

92
Chapter 5: Interpreting High-Resolution Proxy Climate Data
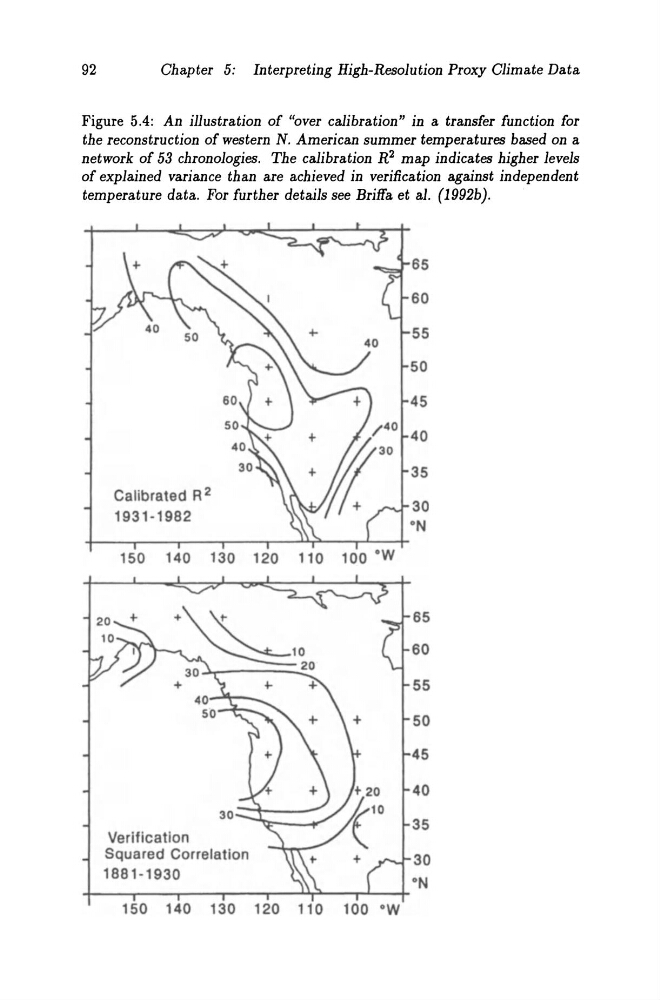
Figure 5.4: An illustration of "over calibration" in a transfer function for
the reconstruction of western N. American summer temperatures based on a
network of 53 chronologies. The calibration R 2 map indicates higher levels
of explained variance than are achieved in veri/kation against independent
temperature data. For further details see Briffa et a1. (1992b).
Chapter 5: Interpreting High-Resolution Proxy Climate Data
Figure 5.4: An illustration of "over calibration" in a transfer function for
the reconstruction of western N. American summer temperatures based on a
network of 53 chronologies. The calibration R 2 map indicates higher levels
of explained variance than are achieved in veri/kation against independent
temperature data. For further details see Briffa et a1. (1992b).