

Applications of Passive and Active Microwave Sensors ...
481
15
\0
140
145
150
155
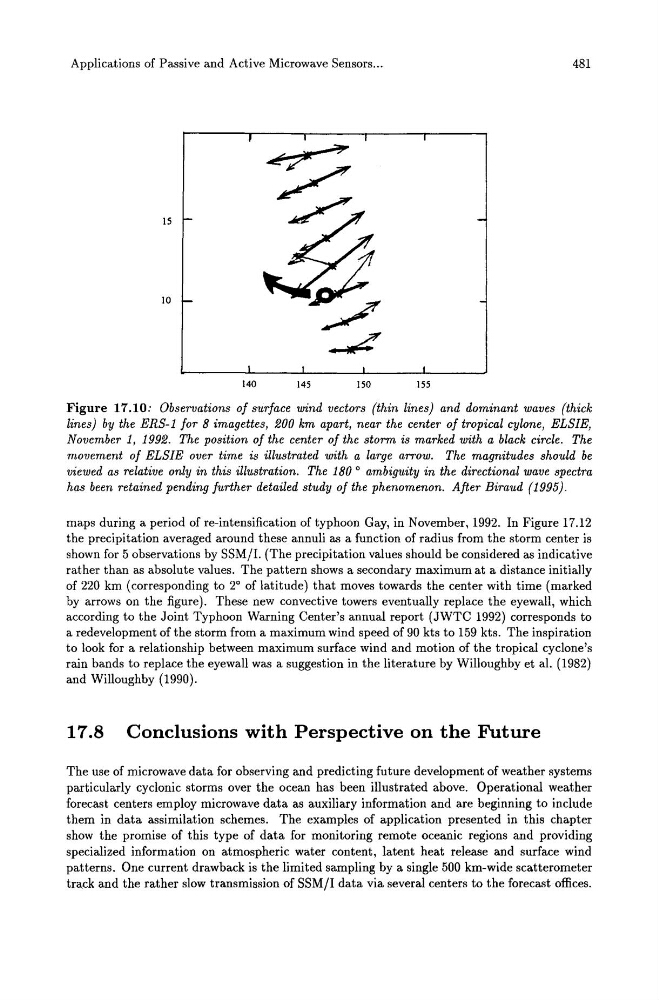
Figure 17.10: Observations of surface wind vectors (thin lines) and dominant waves (thick
lines) by the ERS-1 for 8 imagettes, 200 km apart, near the center of tropical cylone, ELSIE,
November 1, 1992. The position of the center of the storm is marked with a black circle. The
movement of ELSIE over time is illustrated with a large arrow. The magnitudes should be
viewed as relative only in this illustration. The 180 0 ambiguity in the directional wave spectra
has been retained pending further detailed study of the phenomenon. After Biraud (1995).
maps during a period of re-intensification of typhoon Gay, in November, 1992. In Figure 17.12
the precipitation averaged around these annuli as a function of radius from the storm center is
shown for 5 observations by SSM/I. (The precipitation values should be considered as indicative
rather than as absolute values. The pattern shows a secondary maximum at a distance initially
of 220 km (corresponding to 2 0 of latitude) that moves towards the center with time (marked
by arrows on the figure). These new convective towers eventually replace the eyewall, which
according to the Joint Typhoon Warning Center's annual report (JWTC 1992) corresponds to
a redevelopment of the storm from a maximum wind speed of 90 kts to 159 kts. The inspiration
to look for a relationship between maximum surface wind and motion of the tropical cyclone's
rain bands to replace the eyewall was a suggestion in the literature by Willoughby et al. (1982)
and Willoughby (1990).
17.8 Conclusions with Perspective on the Future
The use of microwave data for observing and predicting future development of weather systems
particularly cyclonic storms over the ocean has been illustrated above. Operational weather
forecast centers employ microwave data as auxiliary information and are beginning to include
them in data assimilation schemes. The examples of application presented in this chapter
show the promise of this type of data for monitoring remote oceanic regions and providing
specialized information on atmospheric water content, latent heat release and surface wind
patterns. One current drawback is the limited sampling by a single 500 km-wide scatterometer
track and the rather slow transmission of SSM/I data via several centers to the forecast offices.
481
15
\0
140
145
150
155
Figure 17.10: Observations of surface wind vectors (thin lines) and dominant waves (thick
lines) by the ERS-1 for 8 imagettes, 200 km apart, near the center of tropical cylone, ELSIE,
November 1, 1992. The position of the center of the storm is marked with a black circle. The
movement of ELSIE over time is illustrated with a large arrow. The magnitudes should be
viewed as relative only in this illustration. The 180 0 ambiguity in the directional wave spectra
has been retained pending further detailed study of the phenomenon. After Biraud (1995).
maps during a period of re-intensification of typhoon Gay, in November, 1992. In Figure 17.12
the precipitation averaged around these annuli as a function of radius from the storm center is
shown for 5 observations by SSM/I. (The precipitation values should be considered as indicative
rather than as absolute values. The pattern shows a secondary maximum at a distance initially
of 220 km (corresponding to 2 0 of latitude) that moves towards the center with time (marked
by arrows on the figure). These new convective towers eventually replace the eyewall, which
according to the Joint Typhoon Warning Center's annual report (JWTC 1992) corresponds to
a redevelopment of the storm from a maximum wind speed of 90 kts to 159 kts. The inspiration
to look for a relationship between maximum surface wind and motion of the tropical cyclone's
rain bands to replace the eyewall was a suggestion in the literature by Willoughby et al. (1982)
and Willoughby (1990).
17.8 Conclusions with Perspective on the Future
The use of microwave data for observing and predicting future development of weather systems
particularly cyclonic storms over the ocean has been illustrated above. Operational weather
forecast centers employ microwave data as auxiliary information and are beginning to include
them in data assimilation schemes. The examples of application presented in this chapter
show the promise of this type of data for monitoring remote oceanic regions and providing
specialized information on atmospheric water content, latent heat release and surface wind
patterns. One current drawback is the limited sampling by a single 500 km-wide scatterometer
track and the rather slow transmission of SSM/I data via several centers to the forecast offices.