

480
18
17
16
15
14
'"
'0
. .;l 13
;;;
...J
12
11
-120
Longitude
-115
- 8
-9
- 10
- 11
-12
'"
'0
.;l-13
;;;
...J
- 14
-16
-17
- 18'---- -""'"
55
60
Longitude
65
"
.~
K.B. Katsaros
20
18
16
14
12
10
8
6
4
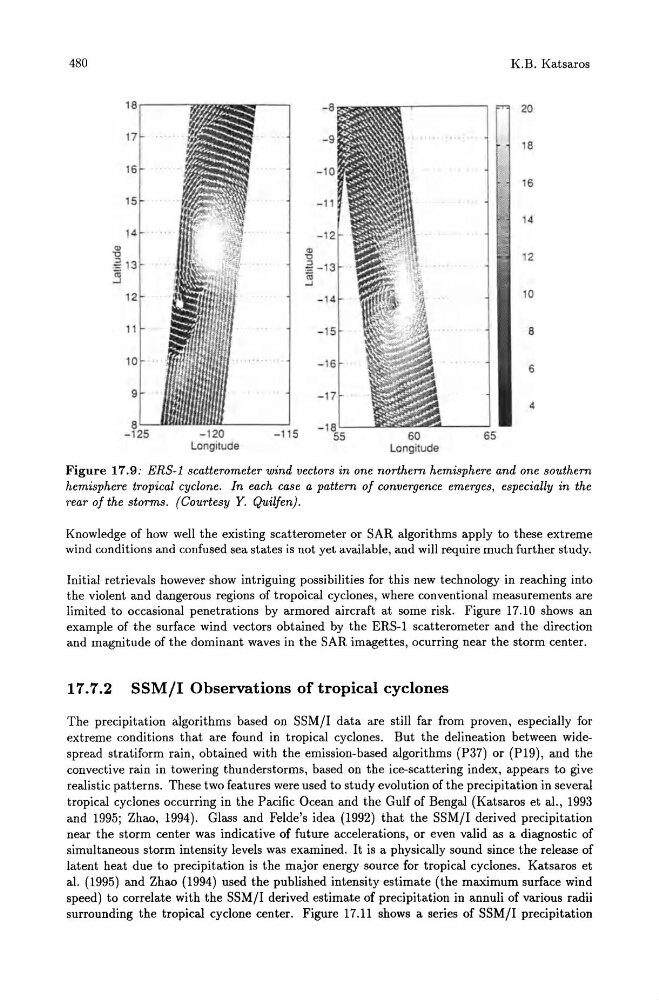
Figure 17.9: ERS-l scatterometer wind vectors in one northern hemisphere and one southern
hemisphere tropical cyclone. In each case a pattern of convergence emerges, especially in the
rear of the storms. (Courtesy Y. Quilfen).
Knowledge of how well the existing scatterometer or SAR algorithms apply to these extreme
wind conditions and confused sea states is not yet available, and will require much further study.
Initial retrievals however show intriguing possibilities for this new technology in reaching into
the violent and dangerous regions of tropoical cyclones, where conventional measurements are
limited to occasional penetrations by armored aircraft at some risk. Figure 17.10 shows an
example of the surface wind vectors obtained by the ERS-l scatterometer and the direction
and magnitude of the dominant waves in the SAR imagettes, ocurring near the storm center.
17.7.2 SSM/I Observations of tropical cyclones
The precipitation algorithms based on SSM/I data are still far from proven, especially for
extreme conditions that are found in tropical cyclones. But the delineation between widespread stratiform rain, obtained with the emission-based algorithms (P37) or (PI9), and the
convective rain in towering thunderstorms, based on the ice-scattering index, appears to give
realistic patterns. These two features were used to study evolution of the precipitation in several
tropical cyclones occurring in the Pacific Ocean and the Gulf of Bengal (Katsaros et al., 1993
and 1995; Zhao, 1994). Glass and Felde's idea (1992) that the SSM/I derived precipitation
near the storm center was indicative of future accelerations, or even valid as a diagnostic of
simultaneous storm intensity levels was examined. It is a physically sound since the release of
latent heat due to precipitation is the major energy source for tropical cyclones. Katsaros et
al. (1995) and Zhao (1994) used the published intensity estimate (the maximum surface wind
speed) to correlate with the SSM/I derived estimate of precipitation in annuli of various radii
surrounding the tropical cyclone center. Figure 17.11 shows a series of SSM/I precipitation
18
17
16
15
14
'"
'0
. .;l 13
;;;
...J
12
11
-120
Longitude
-115
- 8
-9
- 10
- 11
-12
'"
'0
.;l-13
;;;
...J
- 14
-16
-17
- 18'---- -""'"
55
60
Longitude
65
"
.~
K.B. Katsaros
20
18
16
14
12
10
8
6
4
Figure 17.9: ERS-l scatterometer wind vectors in one northern hemisphere and one southern
hemisphere tropical cyclone. In each case a pattern of convergence emerges, especially in the
rear of the storms. (Courtesy Y. Quilfen).
Knowledge of how well the existing scatterometer or SAR algorithms apply to these extreme
wind conditions and confused sea states is not yet available, and will require much further study.
Initial retrievals however show intriguing possibilities for this new technology in reaching into
the violent and dangerous regions of tropoical cyclones, where conventional measurements are
limited to occasional penetrations by armored aircraft at some risk. Figure 17.10 shows an
example of the surface wind vectors obtained by the ERS-l scatterometer and the direction
and magnitude of the dominant waves in the SAR imagettes, ocurring near the storm center.
17.7.2 SSM/I Observations of tropical cyclones
The precipitation algorithms based on SSM/I data are still far from proven, especially for
extreme conditions that are found in tropical cyclones. But the delineation between widespread stratiform rain, obtained with the emission-based algorithms (P37) or (PI9), and the
convective rain in towering thunderstorms, based on the ice-scattering index, appears to give
realistic patterns. These two features were used to study evolution of the precipitation in several
tropical cyclones occurring in the Pacific Ocean and the Gulf of Bengal (Katsaros et al., 1993
and 1995; Zhao, 1994). Glass and Felde's idea (1992) that the SSM/I derived precipitation
near the storm center was indicative of future accelerations, or even valid as a diagnostic of
simultaneous storm intensity levels was examined. It is a physically sound since the release of
latent heat due to precipitation is the major energy source for tropical cyclones. Katsaros et
al. (1995) and Zhao (1994) used the published intensity estimate (the maximum surface wind
speed) to correlate with the SSM/I derived estimate of precipitation in annuli of various radii
surrounding the tropical cyclone center. Figure 17.11 shows a series of SSM/I precipitation