

390
m 10.--------------------------,
~
."
~
w
U
u::
u.
W
o
o ·10
U
(!)
z
0:
w ·20
§
C/l
o
'"
1
',--~10
20
30
40
50
60
ANGLE OF INCIDENCE (degrees)
(a)
§ 10
~
~ 0
it
8
~ ·10
1[
W
"'
5 ·20
S. Palos cia
10
20
30
40
50
ANGLE OF INCIDENCE (degre.s)
(b)
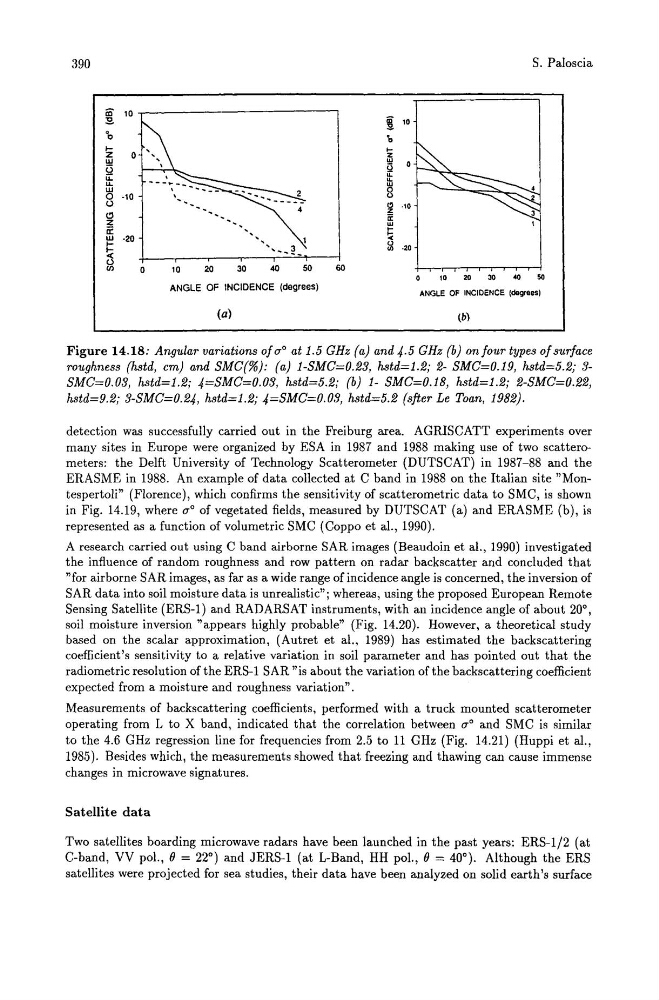
Figure 14.18: Angular variations of (70 at 1.5 GHz (aj and 4.5 GHz (b) on four types of surface
roughness (hstd, cm) and SMC(%): (a) 1-SMC=O.23, hstd=1.2; 2- SMC=O.19, hstd=5.2; 3SMC=O.03, hstd=1.2; 4=SMC=O.03, hstd=5.2; (b) 1- SMC=O.18, hstd=1.2; 2-SMC=O.22,
hstd=9.2; 3-SMC=O.24, hstd=1.2; 4=SMC=O.03, hstd=5.2 (sfter Le Toan, 1982).
detection was successfully carried out in the Freiburg area. AGRISCATT experiments over
many sites in Europe were organized by ESA in 1987 and 1988 making use of two scatterometers: the Delft University of Technology Scatterometer (DUTSCAT) in 1987-88 and the
ERASME in 1988. An example of data collected at C band in 1988 on the Italian site "Montespertoli" (Florence), which confirms the sensitivity of scatterometric data to SMC, is shown
in Fig. 14.19, where (70 of vegetated fields, measured by DUTSCAT (a) and ERASME (b), is
represented as a function of volumetric SMC (Coppo et al., 1990).
A research carried out using C band airborne SAR images (Beaudoin et al., 1990) investigated
the influence of random roughness and row pattern on radar backscatter and concluded that
"for airborne SAR images, as far as a wide range of incidence angle is concerned, the inversion of
SAR data into soil moisture data is unrealistic"; whereas, using the proposed European Remote
Sensing Satellite (ERS-1) and RADARS AT instruments, with an incidence angle of about 20°,
soil moisture inversion "appears highly probable" (Fig. 14.20). However, a theoretical study
based on the scalar approximation, (Autret et al., 1989) has estimated the backscattering
coefficient's sensitivity to a relative variation in soil parameter and has pointed out that the
radiometric resolution of the ERS-1 SAR" is about the variation of the backscattering coefficient
expected from a moisture and roughness variation".
Measurements of backscattering coefficients, performed with a truck mounted scatterometer
operating from L to X band, indicated that the correlation between (70 and SMC is similar
to the 4.6 GHz regression line for frequencies from 2.5 to 11 GHz (Fig. 14.21) (Huppi et al.,
1985). Besides which, the measurements showed that freezing and thawing can cause immense
changes in microwave signatures.
Satellite data
Two satellites boarding microwave radars have been launched in the past years: ERS-1/2 (at
C-band, VV pol., () = 22°) and JERS-1 (at L-Band, HH pol., e = 40°). Although the ERS
satellites were projected for sea studies, their data have been analyzed on solid earth's surface
m 10.--------------------------,
~
."
~
w
U
u::
u.
W
o
o ·10
U
(!)
z
0:
w ·20
§
C/l
o
'"
1
',--~10
20
30
40
50
60
ANGLE OF INCIDENCE (degrees)
(a)
§ 10
~
~ 0
it
8
~ ·10
1[
W
"'
5 ·20
S. Palos cia
10
20
30
40
50
ANGLE OF INCIDENCE (degre.s)
(b)
Figure 14.18: Angular variations of (70 at 1.5 GHz (aj and 4.5 GHz (b) on four types of surface
roughness (hstd, cm) and SMC(%): (a) 1-SMC=O.23, hstd=1.2; 2- SMC=O.19, hstd=5.2; 3SMC=O.03, hstd=1.2; 4=SMC=O.03, hstd=5.2; (b) 1- SMC=O.18, hstd=1.2; 2-SMC=O.22,
hstd=9.2; 3-SMC=O.24, hstd=1.2; 4=SMC=O.03, hstd=5.2 (sfter Le Toan, 1982).
detection was successfully carried out in the Freiburg area. AGRISCATT experiments over
many sites in Europe were organized by ESA in 1987 and 1988 making use of two scatterometers: the Delft University of Technology Scatterometer (DUTSCAT) in 1987-88 and the
ERASME in 1988. An example of data collected at C band in 1988 on the Italian site "Montespertoli" (Florence), which confirms the sensitivity of scatterometric data to SMC, is shown
in Fig. 14.19, where (70 of vegetated fields, measured by DUTSCAT (a) and ERASME (b), is
represented as a function of volumetric SMC (Coppo et al., 1990).
A research carried out using C band airborne SAR images (Beaudoin et al., 1990) investigated
the influence of random roughness and row pattern on radar backscatter and concluded that
"for airborne SAR images, as far as a wide range of incidence angle is concerned, the inversion of
SAR data into soil moisture data is unrealistic"; whereas, using the proposed European Remote
Sensing Satellite (ERS-1) and RADARS AT instruments, with an incidence angle of about 20°,
soil moisture inversion "appears highly probable" (Fig. 14.20). However, a theoretical study
based on the scalar approximation, (Autret et al., 1989) has estimated the backscattering
coefficient's sensitivity to a relative variation in soil parameter and has pointed out that the
radiometric resolution of the ERS-1 SAR" is about the variation of the backscattering coefficient
expected from a moisture and roughness variation".
Measurements of backscattering coefficients, performed with a truck mounted scatterometer
operating from L to X band, indicated that the correlation between (70 and SMC is similar
to the 4.6 GHz regression line for frequencies from 2.5 to 11 GHz (Fig. 14.21) (Huppi et al.,
1985). Besides which, the measurements showed that freezing and thawing can cause immense
changes in microwave signatures.
Satellite data
Two satellites boarding microwave radars have been launched in the past years: ERS-1/2 (at
C-band, VV pol., () = 22°) and JERS-1 (at L-Band, HH pol., e = 40°). Although the ERS
satellites were projected for sea studies, their data have been analyzed on solid earth's surface