

Ground-Based Remote Sensing of Cloud Properties ...
12
j
10
8
~
6
.Q
01
4
....
0
1430
12
j
10
8
~
6
..c:
Ol
4
....
Ql
::r: 2
0
1430
1500
1530
1600
Time (UTe)
(a)
."4'~ ;1_
1500
1530
1600
Time (UTe)
(b)
355
1630
1700
t
1630
1700
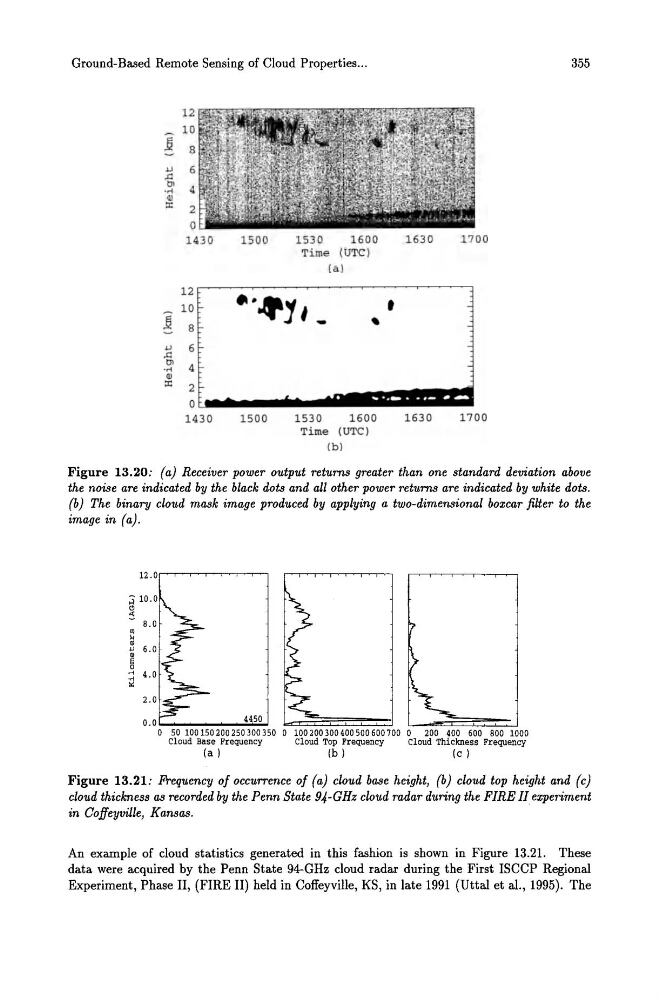
Figure 13.20: (aJ Receiver power output returns greater than one standard deviation above
the noise are indicated by the black dots and all other power returns are indicated by white dots.
(b J The binary cloud mask image produced by applying a two-dimensional boxcar filter to the
image in (aJ.
4450
50 100150200250300350 0 100200300400500600700 0 200 400 600 800 1000
Cloud Base Frequency
Cloud Top Frequency
Cloud Thickness Frequency
(a)
(b)
(e)
Figure 13.21: Frequency of occurrence of (aJ cloud base height, (bJ cloud top height and (cJ
cloud thickness as recorded by the Penn State 94-GHz cloud radar during the FIRE II experiment
in Coffeyville, Kansas.
An example of cloud statistics generated in this fashion is shown in Figure 13.21. These
data were acquired by the Penn State 94-GHz cloud radar during the First ISCCP Regional
Experiment, Phase II, (FIRE II) held in Coffeyville, KS, in late 1991 (Uttal et al., 1995). The
12
j
10
8
~
6
.Q
01
4
....
0
1430
12
j
10
8
~
6
..c:
Ol
4
....
Ql
::r: 2
0
1430
1500
1530
1600
Time (UTe)
(a)
."4'~ ;1_
1500
1530
1600
Time (UTe)
(b)
355
1630
1700
t
1630
1700
Figure 13.20: (aJ Receiver power output returns greater than one standard deviation above
the noise are indicated by the black dots and all other power returns are indicated by white dots.
(b J The binary cloud mask image produced by applying a two-dimensional boxcar filter to the
image in (aJ.
4450
50 100150200250300350 0 100200300400500600700 0 200 400 600 800 1000
Cloud Base Frequency
Cloud Top Frequency
Cloud Thickness Frequency
(a)
(b)
(e)
Figure 13.21: Frequency of occurrence of (aJ cloud base height, (bJ cloud top height and (cJ
cloud thickness as recorded by the Penn State 94-GHz cloud radar during the FIRE II experiment
in Coffeyville, Kansas.
An example of cloud statistics generated in this fashion is shown in Figure 13.21. These
data were acquired by the Penn State 94-GHz cloud radar during the First ISCCP Regional
Experiment, Phase II, (FIRE II) held in Coffeyville, KS, in late 1991 (Uttal et al., 1995). The