

Ground-Based Remote Sensing of Cloud Properties ...
347
_I [All Noi •• a.m1 s1 n.al"'NQisa Power [No Aver in I
l·U
{BII Noise and s1 1" •• 1+Nohe Power 1100 Ave-rll. edl
5'0
100
UO
SUpl e ~.1' llOO Av . It~ • • p,n' SiIIIIII'le l
1~(I
if.O
$~l. ~I" C'- Ave,.. o l I'lOI
(821 Noise and. S1 nahNolse Power (l00 Aven &4)
".O .10· ·°L-... _ _ ~-'-~_~~"""'~~~-L _ _ ~~...J
2(10
I)
50
lOG
,J..uIipl .. ~r 1100 A,V. " AogIU p ili" S~ h)
' ,L. --~~,:'-.~---,..L."... ~~-~,,':'.~~--::2GO 1 . 10 . 10·t~. --~~,=,~--""'":,:7 .. :-"~~-~,,':'.-~~"""::!,01
~l . ~I" CUtDO(l Ay e n 9 •• pou s .... 1II,.
1 1IIIIIIP1. -'-"1: "OctOO Aver.g •• per ~1 . 1
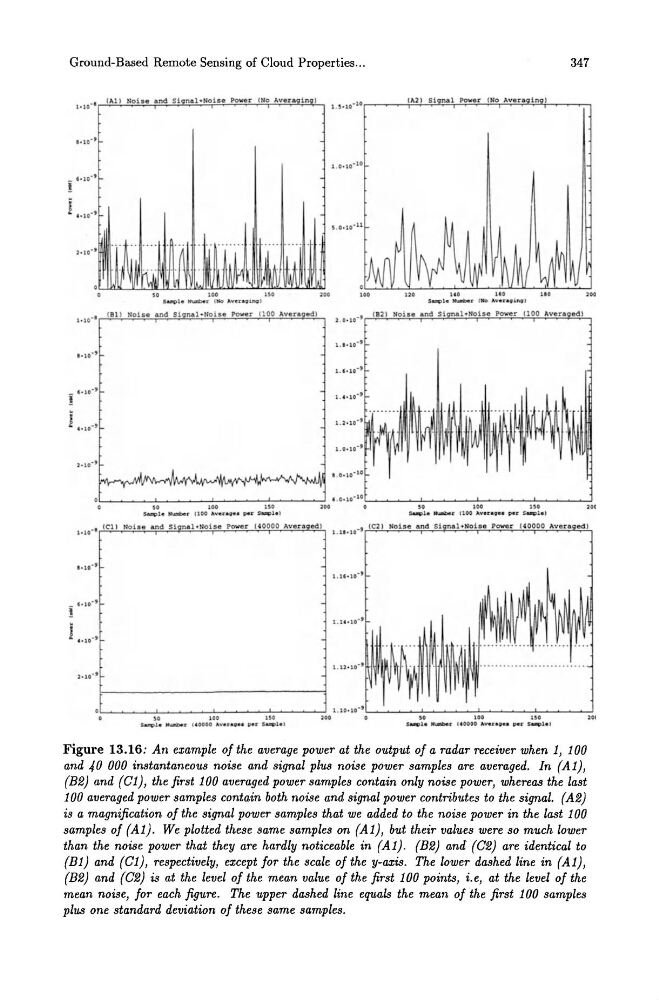
Figure 13.16: An example of the average power at the output of a radar receiver when 1, 100
and 40 000 instantaneous noise and signal plus noise power samples are averaged. In (A 1),
(B2) and (Cl), the first 100 averaged power samples contain only noise power, whereas the last
100 averaged power samples contain both noise and signal power contributes to the signal. (A2)
is a magnification of the signal power samples that we added to the noise power in the last 100
samples of (Al). We plotted these same samples on (Al), but their values were so much lower
than the noise power that they are hardly noticeable in (Al). (B2) and (C2) are identical to
(Bl) and (Cl), respectively, except for the scale of the y-axis. The lower dashed line in (Al),
(B2) and (C2) is at the level of the mean value of the first 100 points, i.e, at the level of the
mean noise, for each figure. The upper dashed line equals the mean of the first 100 samples
plus one standard deviation of these same samples.
347
_I [All Noi •• a.m1 s1 n.al"'NQisa Power [No Aver in I
l·U
{BII Noise and s1 1" •• 1+Nohe Power 1100 Ave-rll. edl
5'0
100
UO
SUpl e ~.1' llOO Av . It~ • • p,n' SiIIIIII'le l
1~(I
if.O
$~l. ~I" C'- Ave,.. o l I'lOI
(821 Noise and. S1 nahNolse Power (l00 Aven &4)
".O .10· ·°L-... _ _ ~-'-~_~~"""'~~~-L _ _ ~~...J
2(10
I)
50
lOG
,J..uIipl .. ~r 1100 A,V. " AogIU p ili" S~ h)
' ,L. --~~,:'-.~---,..L."... ~~-~,,':'.~~--::2GO 1 . 10 . 10·t~. --~~,=,~--""'":,:7 .. :-"~~-~,,':'.-~~"""::!,01
~l . ~I" CUtDO(l Ay e n 9 •• pou s .... 1II,.
1 1IIIIIIP1. -'-"1: "OctOO Aver.g •• per ~1 . 1
Figure 13.16: An example of the average power at the output of a radar receiver when 1, 100
and 40 000 instantaneous noise and signal plus noise power samples are averaged. In (A 1),
(B2) and (Cl), the first 100 averaged power samples contain only noise power, whereas the last
100 averaged power samples contain both noise and signal power contributes to the signal. (A2)
is a magnification of the signal power samples that we added to the noise power in the last 100
samples of (Al). We plotted these same samples on (Al), but their values were so much lower
than the noise power that they are hardly noticeable in (Al). (B2) and (C2) are identical to
(Bl) and (Cl), respectively, except for the scale of the y-axis. The lower dashed line in (Al),
(B2) and (C2) is at the level of the mean value of the first 100 points, i.e, at the level of the
mean noise, for each figure. The upper dashed line equals the mean of the first 100 samples
plus one standard deviation of these same samples.