

312
P. Joe
WEST·EAST (KMJ
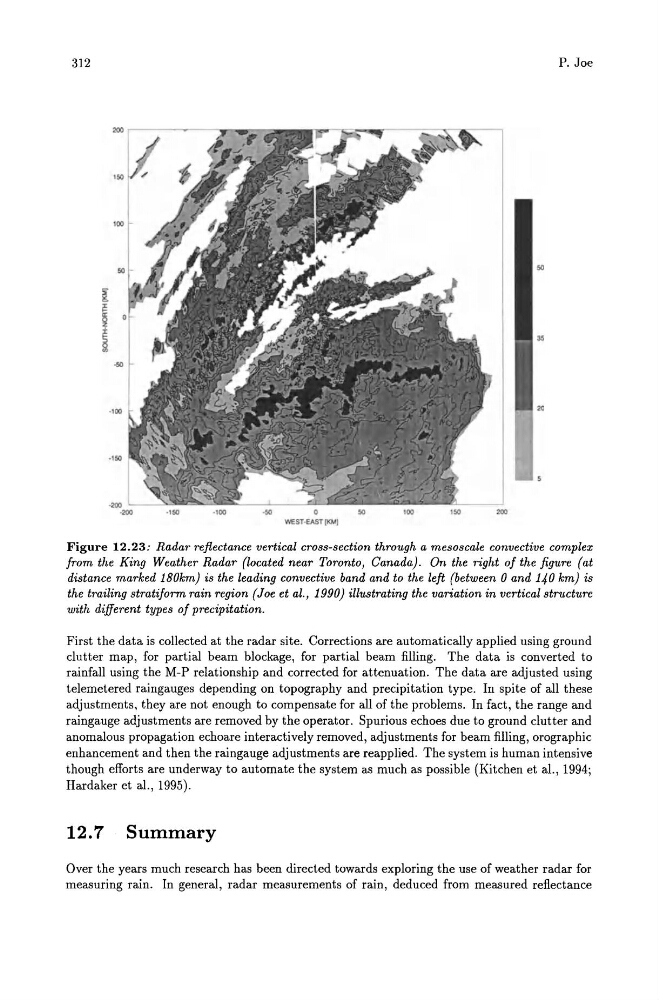
Figure 12.23: Radar reflectance vertical cross-section through a mesoscale convective complex
from the King Weather Radar (located near Toronto, Canada). On the right of the figure (at
distance marked 180km) is the leading convective band and to the left (between 0 and 140 km) is
the trailing stratiform rain region (Joe et al., 1990) illustrating the variation in vertical structure
with different types of precipitation.
First the data is collected at the radar site. Corrections are automatically applied using ground
clutter map, for partial beam blockage, for partial beam filling. The data is converted to
rainfall using the M-P relationship and corrected for attenuation. The data are adjusted using
telemetered raingauges depending on topography and precipitation type. In spite of all these
adjustments, they are not enough to compensate for all of the problems. In fact, the range and
raingauge adjustments are removed by the operator. Spurious echoes due to ground clutter and
anomalous propagation echoare interactively removed, adjustments for beam filling, orographic
enhancement and then the raingauge adjustments are reapplied. The system is human intensive
though efforts are underway to automate the system as much as possible (Kitchen et al., 1994;
Hardaker et al., 1995).
12.7 Summary
Over the years much research has been directed towards exploring the use of weather radar for
measuring rain. In general, radar measurements of rain, deduced from measured reflectance
P. Joe
WEST·EAST (KMJ
Figure 12.23: Radar reflectance vertical cross-section through a mesoscale convective complex
from the King Weather Radar (located near Toronto, Canada). On the right of the figure (at
distance marked 180km) is the leading convective band and to the left (between 0 and 140 km) is
the trailing stratiform rain region (Joe et al., 1990) illustrating the variation in vertical structure
with different types of precipitation.
First the data is collected at the radar site. Corrections are automatically applied using ground
clutter map, for partial beam blockage, for partial beam filling. The data is converted to
rainfall using the M-P relationship and corrected for attenuation. The data are adjusted using
telemetered raingauges depending on topography and precipitation type. In spite of all these
adjustments, they are not enough to compensate for all of the problems. In fact, the range and
raingauge adjustments are removed by the operator. Spurious echoes due to ground clutter and
anomalous propagation echoare interactively removed, adjustments for beam filling, orographic
enhancement and then the raingauge adjustments are reapplied. The system is human intensive
though efforts are underway to automate the system as much as possible (Kitchen et al., 1994;
Hardaker et al., 1995).
12.7 Summary
Over the years much research has been directed towards exploring the use of weather radar for
measuring rain. In general, radar measurements of rain, deduced from measured reflectance