

Precipitation at the Ground: Radar Techniques
7
'E5
~
-
-6,3
'03
I
1
o
7 ~~~~~------~~~--~--~
'E5
~
-
.c 3
C>
'03
I
1
0
7
'E5~c----I---I-~-+--I-----l--+--+-+--+-----l
~
-
-6, 3 ~~~--~~-+~~+-~-4--+-~~
'03
I
1
0==
o 50 100 150 200
Range [km]
250
311
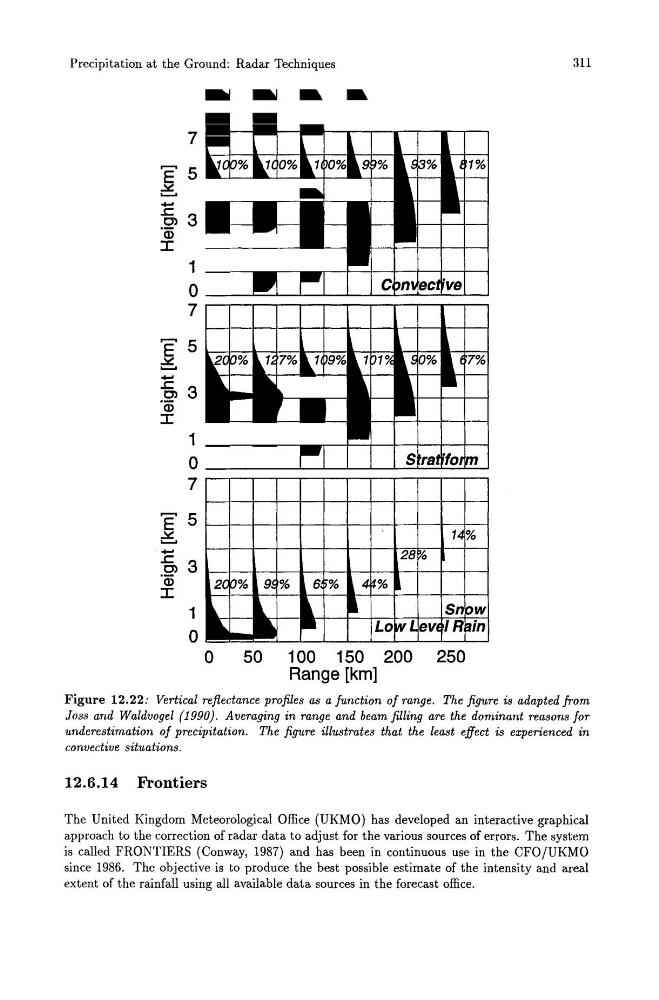
Figure 12.22: Vertical reflectance profiles as a function of range. The figure is adapted from
Joss and Waldvogel (1990). Averaging in range and beam filling are the dominant reasons for
underestimation of precipitation. The figure illustrates that the least effect is experienced in
convective situations.
12.6.14 Frontiers
The United Kingdom Meteorological Office (UKMO) has developed an interactive graphical
approach to the correction of radar data to adjust for the various sources of errors. The system
is called FRONTIERS (Conway, 1987) and has been in continuous use in the CFO/UKMO
since 1986. The objective is to produce the best possible estimate of the intensity and areal
extent of the rainfall using all available data sources in the forecast office.
7
'E5
~
-
-6,3
'03
I
1
o
7 ~~~~~------~~~--~--~
'E5
~
-
.c 3
C>
'03
I
1
0
7
'E5~c----I---I-~-+--I-----l--+--+-+--+-----l
~
-
-6, 3 ~~~--~~-+~~+-~-4--+-~~
'03
I
1
0==
o 50 100 150 200
Range [km]
250
311
Figure 12.22: Vertical reflectance profiles as a function of range. The figure is adapted from
Joss and Waldvogel (1990). Averaging in range and beam filling are the dominant reasons for
underestimation of precipitation. The figure illustrates that the least effect is experienced in
convective situations.
12.6.14 Frontiers
The United Kingdom Meteorological Office (UKMO) has developed an interactive graphical
approach to the correction of radar data to adjust for the various sources of errors. The system
is called FRONTIERS (Conway, 1987) and has been in continuous use in the CFO/UKMO
since 1986. The objective is to produce the best possible estimate of the intensity and areal
extent of the rainfall using all available data sources in the forecast office.