

Precipitation at the Ground: Radar Techniques
Object
Aircraft
Man
Weather Balloon
Birds
Bees, dragonflies, moths
2 mm water drop
10 to 1000
0.14 to 1.05
0.01
0.001 to 0.01
3 x 10- 6 to 10- 5
1.8 X 10- 10
Table 12.4: Typical backscatter cross-sections for various targets.
12.3.6 Sources of error
289
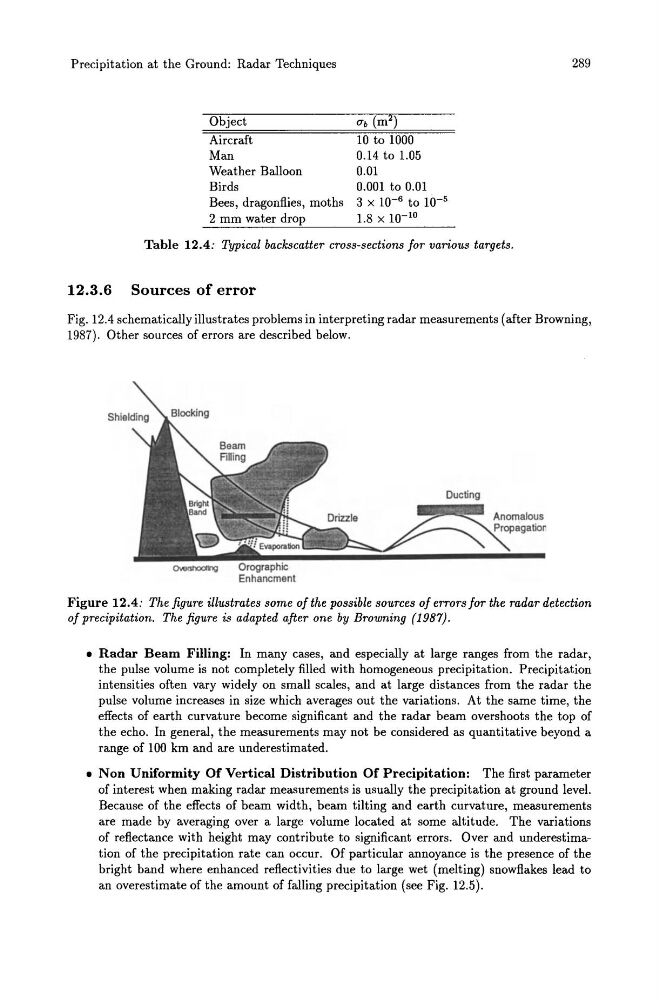
Fig. 12.4 schematically illustrates problems in interpreting radar measurements (after Browning,
1987). Other sources of errors are described below.
Orographic
Enhancment
Figure 12.4: The figure illustrates some of the possible sources of errors for the radar detection
of precipitation. The figure is adapted after one by Browning (1987) .
• Radar Beam Filling: In many cases, and especially at large ranges from the radar,
the pulse volume is not completely filled with homogeneous precipitation. Precipitation
intensities often vary widely on small scales, and at large distances from the radar the
pulse volume increases in size which averages out the variations. At the same time, the
effects of earth curvature become significant and the radar beam overshoots the top of
the echo. In general, the measurements may not be considered as quantitative beyond a
range of 100 km and are underestimated .
• Non Uniformity Of Vertical Distribution Of Precipitation: The first parameter
of interest when making radar measurements is usually the precipitation at ground level.
Because of the effects of beam width, beam tilting and earth curvature, measurements
are made by averaging over a large volume located at some altitude. The variations
of reflectance with height may contribute to significant errors. Over and underestimation of the precipitation rate can occur. Of particular annoyance is the presence of the
bright band where enhanced reflectivities due to large wet (melting) snowflakes lead to
an overestimate of the amount of falling precipitation (see Fig. 12.5).
Object
Aircraft
Man
Weather Balloon
Birds
Bees, dragonflies, moths
2 mm water drop
10 to 1000
0.14 to 1.05
0.01
0.001 to 0.01
3 x 10- 6 to 10- 5
1.8 X 10- 10
Table 12.4: Typical backscatter cross-sections for various targets.
12.3.6 Sources of error
289
Fig. 12.4 schematically illustrates problems in interpreting radar measurements (after Browning,
1987). Other sources of errors are described below.
Orographic
Enhancment
Figure 12.4: The figure illustrates some of the possible sources of errors for the radar detection
of precipitation. The figure is adapted after one by Browning (1987) .
• Radar Beam Filling: In many cases, and especially at large ranges from the radar,
the pulse volume is not completely filled with homogeneous precipitation. Precipitation
intensities often vary widely on small scales, and at large distances from the radar the
pulse volume increases in size which averages out the variations. At the same time, the
effects of earth curvature become significant and the radar beam overshoots the top of
the echo. In general, the measurements may not be considered as quantitative beyond a
range of 100 km and are underestimated .
• Non Uniformity Of Vertical Distribution Of Precipitation: The first parameter
of interest when making radar measurements is usually the precipitation at ground level.
Because of the effects of beam width, beam tilting and earth curvature, measurements
are made by averaging over a large volume located at some altitude. The variations
of reflectance with height may contribute to significant errors. Over and underestimation of the precipitation rate can occur. Of particular annoyance is the presence of the
bright band where enhanced reflectivities due to large wet (melting) snowflakes lead to
an overestimate of the amount of falling precipitation (see Fig. 12.5).