

212
W.B. Rossow
100
200
~OO
400
500
600
700
800
900
1000 L---~~--~~~~--~~~~~~~----~~--~--~
lOa
200
_300
.-=.
-.S.400
~ 500
~ 600
V1
~ 700
Co.. 800
900
1 000L-------~~~~L-~~--~~~~~~--------~~--~
100
.'
200
300
400
500
600
700
800
900
1 000~~~~~~~~~~~~~~~~~~~~~~~
(-35 .0.-1 .5)
(-U.S,-5.C)
A
(- 10.0,-2.5)
(2.5,O.Oj
DISTANCE AlO~ AS
5il
•
thi clo~d
I ick cloud
( 15 .0,2 .5)
(27 .5,5.0 )
8
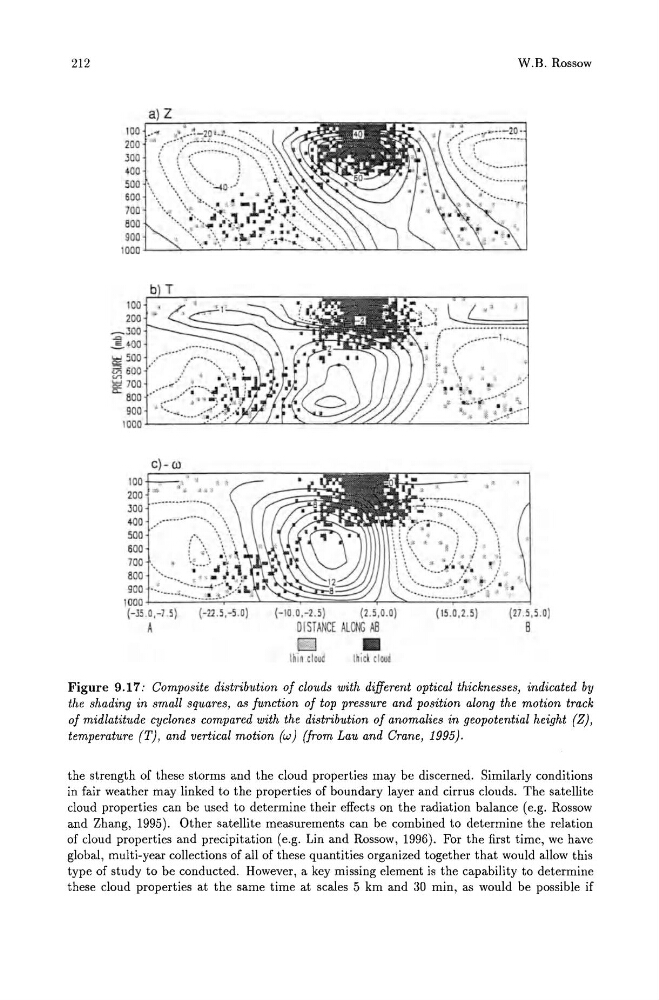
Figure 9.17.' Composite distribution of clouds with different optical thicknesses, indicated by
the shading in small squares, as function of top pressure and position along the motion track
of midlatitude cyclones compared with the distribution of anomalies in geopotential height (Z),
temperature (T), and vertical motion (w) (from Lau and Crane, 1995).
the strength of these storms and the cloud properties may be discerned. Similarly conditions
in fair weather may linked to the properties of boundary layer and cirrus clouds. The satellite
cloud properties can be used to determine their effects on the radiation balance (e.g. Rossow
and Zhang, 1995). Other satellite measurements can be combined to determine the relation
of cloud properties and precipitation (e.g. Lin and Rossow, 1996). For the first time, we have
global, multi-year collections of all of these quantities organized together that would allow this
type of study to be conducted. However, a key missing element is the capability to determine
these cloud properties at the same time at scales 5 km and 30 min, as would be possible if
W.B. Rossow
100
200
~OO
400
500
600
700
800
900
1000 L---~~--~~~~--~~~~~~~----~~--~--~
lOa
200
_300
.-=.
-.S.400
~ 500
~ 600
V1
~ 700
Co.. 800
900
1 000L-------~~~~L-~~--~~~~~~--------~~--~
100
.'
200
300
400
500
600
700
800
900
1 000~~~~~~~~~~~~~~~~~~~~~~~
(-35 .0.-1 .5)
(-U.S,-5.C)
A
(- 10.0,-2.5)
(2.5,O.Oj
DISTANCE AlO~ AS
5il
•
thi clo~d
I ick cloud
( 15 .0,2 .5)
(27 .5,5.0 )
8
Figure 9.17.' Composite distribution of clouds with different optical thicknesses, indicated by
the shading in small squares, as function of top pressure and position along the motion track
of midlatitude cyclones compared with the distribution of anomalies in geopotential height (Z),
temperature (T), and vertical motion (w) (from Lau and Crane, 1995).
the strength of these storms and the cloud properties may be discerned. Similarly conditions
in fair weather may linked to the properties of boundary layer and cirrus clouds. The satellite
cloud properties can be used to determine their effects on the radiation balance (e.g. Rossow
and Zhang, 1995). Other satellite measurements can be combined to determine the relation
of cloud properties and precipitation (e.g. Lin and Rossow, 1996). For the first time, we have
global, multi-year collections of all of these quantities organized together that would allow this
type of study to be conducted. However, a key missing element is the capability to determine
these cloud properties at the same time at scales 5 km and 30 min, as would be possible if