

186
W.B. Rossow
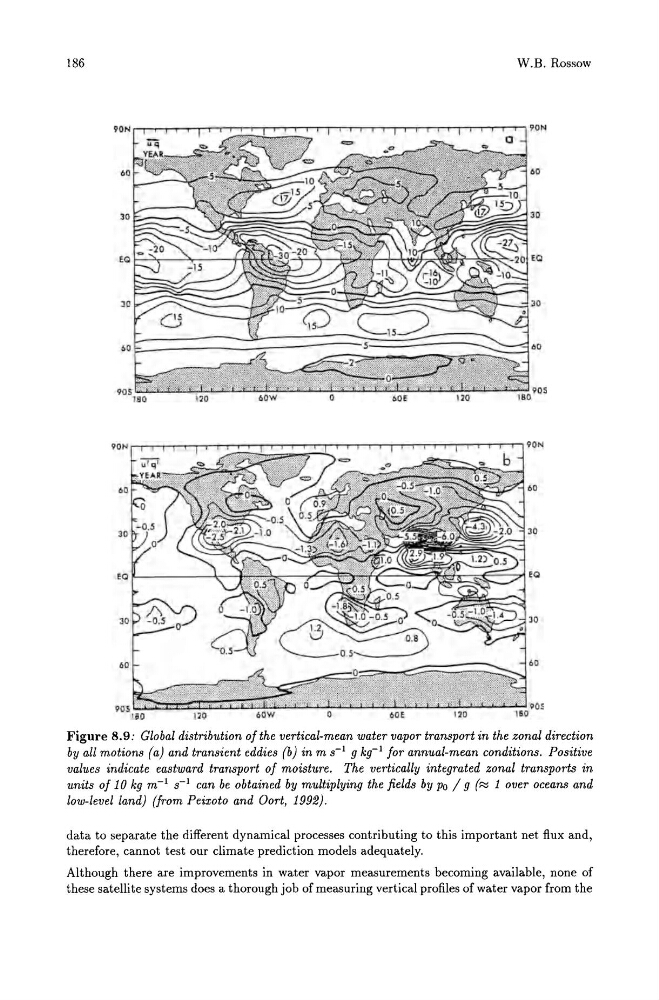
Figure 8.9: Global distribution of the vertical-mean water vapor transport in the zonal direction
by all motions (a) and transient eddies (b) in m S-1 g kg- l for annual-mean conditions. Positive
values indicate eastward transport of moisture. The vertically integrated zonal transports in
units of 10 kg m- l S-1 can be obtained by multiplying the fields by Po / g (r:;,; lover oceans and
low-level land) (from Peixoto and Oort, 1992) .
data to separate the different dynamical processes contributing to this important net flux and,
therefore, cannot test our climate prediction models adequately.
Although there are improvements in water vapor measurements becoming available, none of
these satellite systems does a thorough job of measuring vertical profiles of water vapor from the
W.B. Rossow
Figure 8.9: Global distribution of the vertical-mean water vapor transport in the zonal direction
by all motions (a) and transient eddies (b) in m S-1 g kg- l for annual-mean conditions. Positive
values indicate eastward transport of moisture. The vertically integrated zonal transports in
units of 10 kg m- l S-1 can be obtained by multiplying the fields by Po / g (r:;,; lover oceans and
low-level land) (from Peixoto and Oort, 1992) .
data to separate the different dynamical processes contributing to this important net flux and,
therefore, cannot test our climate prediction models adequately.
Although there are improvements in water vapor measurements becoming available, none of
these satellite systems does a thorough job of measuring vertical profiles of water vapor from the