

Remote Sensing of Atmospheric Water Vapor
BLACK BODY
CURVES
0.) 0.150.1 0.3
0.5
1.5 2
(0)
10
15 10 30
50
190
IOOr-------.-----------. . ~~_r_.~--._~~~~--------~
80
GROUND
(b)
60
LEVEL
40
(d)
CH.
50
O~---------------------~~~~~--------------~
~ 50
N,O
I ~f ~--~--~--------------~~~~--~~--~-------O-2-.n-d-0-1,
'" 50
50
or--r-r-,~~~~~~~L-~~rT~~~"2rO-'3'0---·To~~
0.1 0.150.2 0.3
0.5
\.5 2
5
10
>
100
WAVELENGTH II' I
179
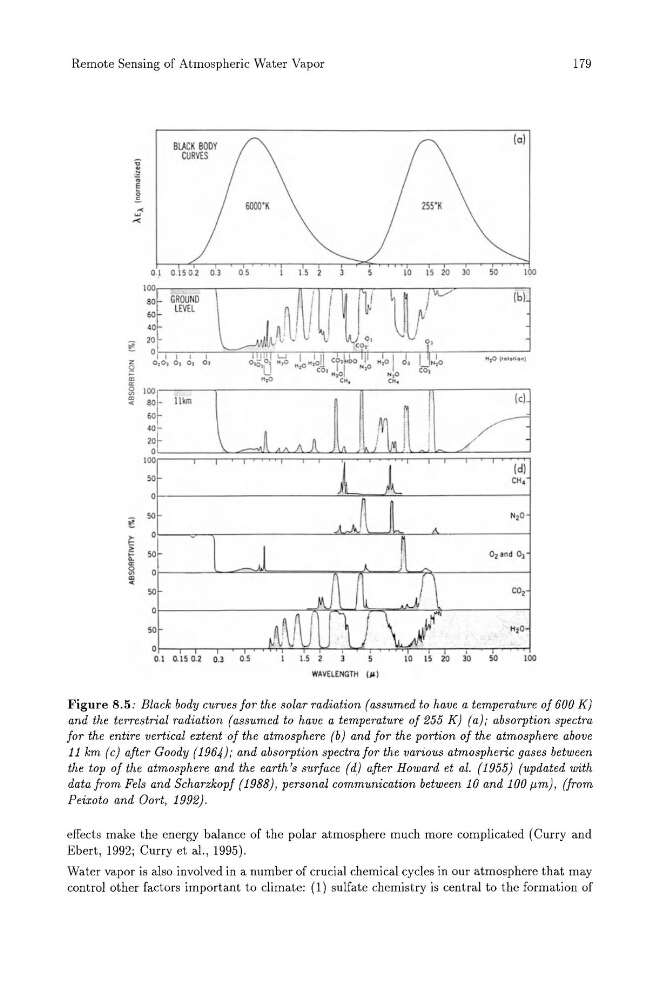
Figure 8.5: Black body curves for the solar radiation (assumed to have a temperature of 600 K)
and the terrestrial radiation (assumed to have a temperature of 255 K) (a),. absorption spectra
for the entire vertical extent of the atmosphere (b) and for the portion of the atmosphere above
11 km (c) after Goody (1964); and absorption spectra for the various atmospheric gases between
the top of the atmosphere and the earth's surface (d) after Howard et al. (1955) (updated with
data from Fels and Scharzkopf (1988), personal communication between 10 and 100 pm), (from
Peixoto and Oort, 1992).
effects make the energy balance of the polar atmosphere much more complicated (Curry and
Ebert, 1992; Curry et al. , 1995).
Water vapor is also involved in a number of crucial chemical cycles in our atmosphere that may
control other factors important to climate: (1) sulfate chemistry is central to the formation of
BLACK BODY
CURVES
0.) 0.150.1 0.3
0.5
1.5 2
(0)
10
15 10 30
50
190
IOOr-------.-----------. . ~~_r_.~--._~~~~--------~
80
GROUND
(b)
60
LEVEL
40
(d)
CH.
50
O~---------------------~~~~~--------------~
~ 50
N,O
I ~f ~--~--~--------------~~~~--~~--~-------O-2-.n-d-0-1,
'" 50
50
or--r-r-,~~~~~~~L-~~rT~~~"2rO-'3'0---·To~~
0.1 0.150.2 0.3
0.5
\.5 2
5
10
>
100
WAVELENGTH II' I
179
Figure 8.5: Black body curves for the solar radiation (assumed to have a temperature of 600 K)
and the terrestrial radiation (assumed to have a temperature of 255 K) (a),. absorption spectra
for the entire vertical extent of the atmosphere (b) and for the portion of the atmosphere above
11 km (c) after Goody (1964); and absorption spectra for the various atmospheric gases between
the top of the atmosphere and the earth's surface (d) after Howard et al. (1955) (updated with
data from Fels and Scharzkopf (1988), personal communication between 10 and 100 pm), (from
Peixoto and Oort, 1992).
effects make the energy balance of the polar atmosphere much more complicated (Curry and
Ebert, 1992; Curry et al. , 1995).
Water vapor is also involved in a number of crucial chemical cycles in our atmosphere that may
control other factors important to climate: (1) sulfate chemistry is central to the formation of