

Harris and Mason (1992) found that for a given change in surface temperature
ΔT 0 , the resulting changes in brightness temperatures in the two wavebands has the
following relationship:
ΔT 2
ΔT 1
¼
ε 2
ε 1
τ 2 ð0; p 0 Þ
τ 1 ð0; p 0 Þ
(19.4)
where ε is the surface emissivity, τ is the atmospheric transmittance, and subscripts
1 and 2 refer to the index of the two channels. The absorbing gases can be divided
into water vapor and other gases as follows:
τ λ 0; p 0
ð
Þ¼exp Àk wλ U w 0; p 0
ð
Þ
ð
Þ exp Àk oλ U o 0; p 0
ð
Þ
ð
Þ
(19.5)
where k Wλ and k oλ are the band-averaged absorption coefficients for water vapor
and other gases, respectively; U w (0, p 0 ) and U o (0, p 0 ) are the total column contents
of water vapor and other gases, respectively. Apply this to Eq. 19.4, yields
ΔT 2
ΔT 1
¼
ε 2
ε 1
exp k w1 À k w2
ð
Þ U w 0; p 0
ð
Þ
ð
Þ exp ðk o1 À k o2
ð
Þ U o 0; p 0
ð
Þ
ð
Þ
(19.6)
Assuming the magnitude (k w1 À k w2 ) and U w (0, p 0 ) is small, and it is reasonable to
take the first-order expansion. As U w (0, p 0 ) is the total column water or precipitable
water W, we get
ΔT 2
ΔT 1
%
ε 2
ε 1
ð1 þ KW þ const:Þ
(19.7)
1.0
1.0
0.8
0.6
0.4
0.2
0.0
0.8
0.6
0.4
0.2
0.0
2
4
Transmittance
Wavelength (micron)
6
8
10
12
14
16
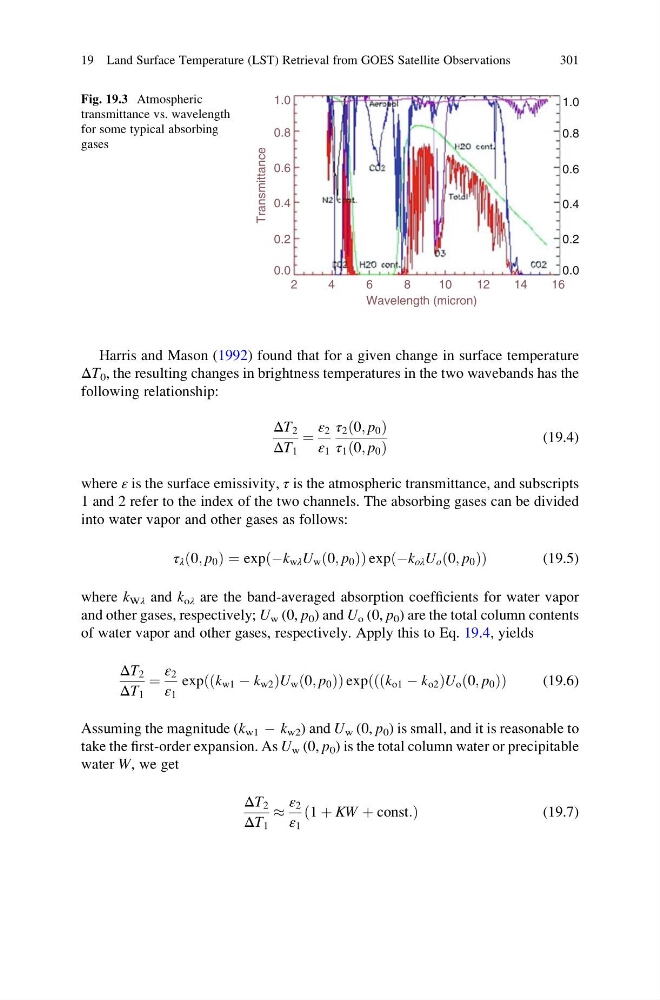
Fig. 19.3 Atmospheric
transmittance vs. wavelength
for some typical absorbing
gases
19 Land Surface Temperature (LST) Retrieval from GOES Satellite Observations
301
ΔT 0 , the resulting changes in brightness temperatures in the two wavebands has the
following relationship:
ΔT 2
ΔT 1
¼
ε 2
ε 1
τ 2 ð0; p 0 Þ
τ 1 ð0; p 0 Þ
(19.4)
where ε is the surface emissivity, τ is the atmospheric transmittance, and subscripts
1 and 2 refer to the index of the two channels. The absorbing gases can be divided
into water vapor and other gases as follows:
τ λ 0; p 0
ð
Þ¼exp Àk wλ U w 0; p 0
ð
Þ
ð
Þ exp Àk oλ U o 0; p 0
ð
Þ
ð
Þ
(19.5)
where k Wλ and k oλ are the band-averaged absorption coefficients for water vapor
and other gases, respectively; U w (0, p 0 ) and U o (0, p 0 ) are the total column contents
of water vapor and other gases, respectively. Apply this to Eq. 19.4, yields
ΔT 2
ΔT 1
¼
ε 2
ε 1
exp k w1 À k w2
ð
Þ U w 0; p 0
ð
Þ
ð
Þ exp ðk o1 À k o2
ð
Þ U o 0; p 0
ð
Þ
ð
Þ
(19.6)
Assuming the magnitude (k w1 À k w2 ) and U w (0, p 0 ) is small, and it is reasonable to
take the first-order expansion. As U w (0, p 0 ) is the total column water or precipitable
water W, we get
ΔT 2
ΔT 1
%
ε 2
ε 1
ð1 þ KW þ const:Þ
(19.7)
1.0
1.0
0.8
0.6
0.4
0.2
0.0
0.8
0.6
0.4
0.2
0.0
2
4
Transmittance
Wavelength (micron)
6
8
10
12
14
16
Fig. 19.3 Atmospheric
transmittance vs. wavelength
for some typical absorbing
gases
19 Land Surface Temperature (LST) Retrieval from GOES Satellite Observations
301