

interpolation procedure. ET r values represent the ET rate expected from a well-defined
surface of full-cover alfalfa and are computed using the point weather data from the
weather stations listed in Table 13.1. The resulting monthly ET maps provided the basis
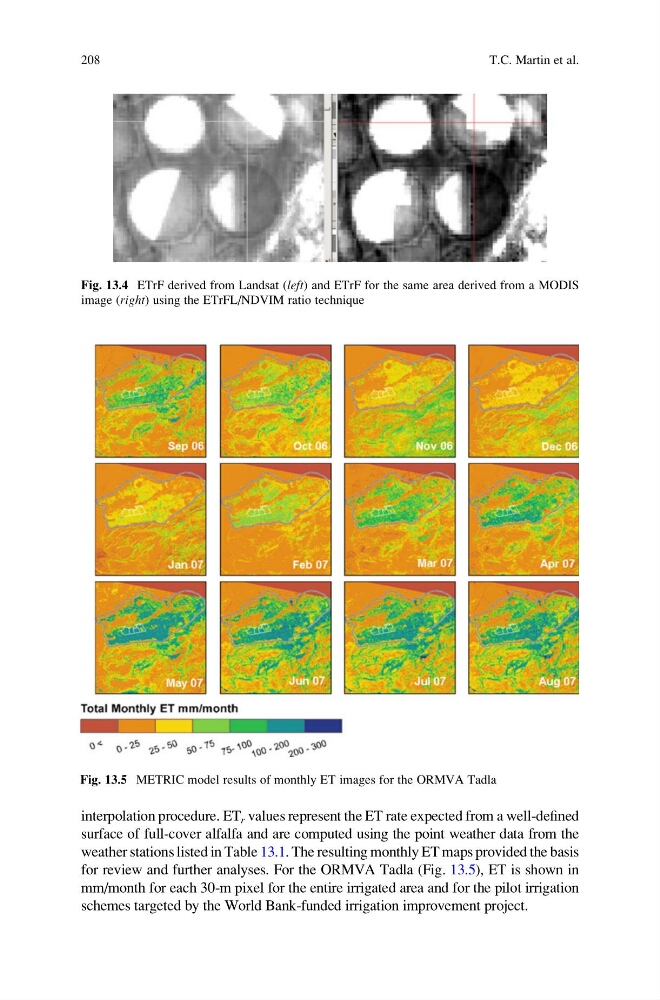
for review and further analyses. For the ORMVA Tadla (Fig. 13.5), ET is shown in
mm/month for each 30-m pixel for the entire irrigated area and for the pilot irrigation
schemes targeted by the World Bank-funded irrigation improvement project.
Fig. 13.4 ETrF derived from Landsat (left) and ETrF for the same area derived from a MODIS
image (right) using the ETrFL/NDVIM ratio technique
Fig. 13.5 METRIC model results of monthly ET images for the ORMVA Tadla
208
T.C. Martin et al.
surface of full-cover alfalfa and are computed using the point weather data from the
weather stations listed in Table 13.1. The resulting monthly ET maps provided the basis
for review and further analyses. For the ORMVA Tadla (Fig. 13.5), ET is shown in
mm/month for each 30-m pixel for the entire irrigated area and for the pilot irrigation
schemes targeted by the World Bank-funded irrigation improvement project.
Fig. 13.4 ETrF derived from Landsat (left) and ETrF for the same area derived from a MODIS
image (right) using the ETrFL/NDVIM ratio technique
Fig. 13.5 METRIC model results of monthly ET images for the ORMVA Tadla
208
T.C. Martin et al.