

As a result of applying the METRIC methodology, daily images of spatially
distributed fractions of the calculated reference ET value (ET r F) became available.
These maps (referred to as ET r F maps) were derived from the METRIC-processed
Landsat images interpolated daily via correlation with reference meteorological
data and cubic splining. Monthly and seasonal estimates of actual ET were
computed with GIS analysis by summation of the daily ET images.
13.5.3 ET Estimates
By applying the METRIC method and interpolation techniques and combining
MODIS and Landsat data, ET results for individual parcels were discerned nearer
to the original 30-m resolution of Landsat images than to the 250-m resolution of the
MODIS-based NDVI. This was accomplished by ratio of 30-m pixels for ET r F/NDVI,
allowing ET r F L /NDVI M ratios along field edges to retain much of their boundary
definition. As shown in Fig. 13.4, the edges of irrigation center pivot parcels remain
relatively clear and well defined. The derived ET r F for some interior pixels takes on
the blocky form of the 250-m MODIS NDVI pixels.
Monthly ET images were generated by multiplying daily ET r F by the corresponding
daily alfalfa-based reference evapotranspiration (ET r ) within a monthly cubic splining
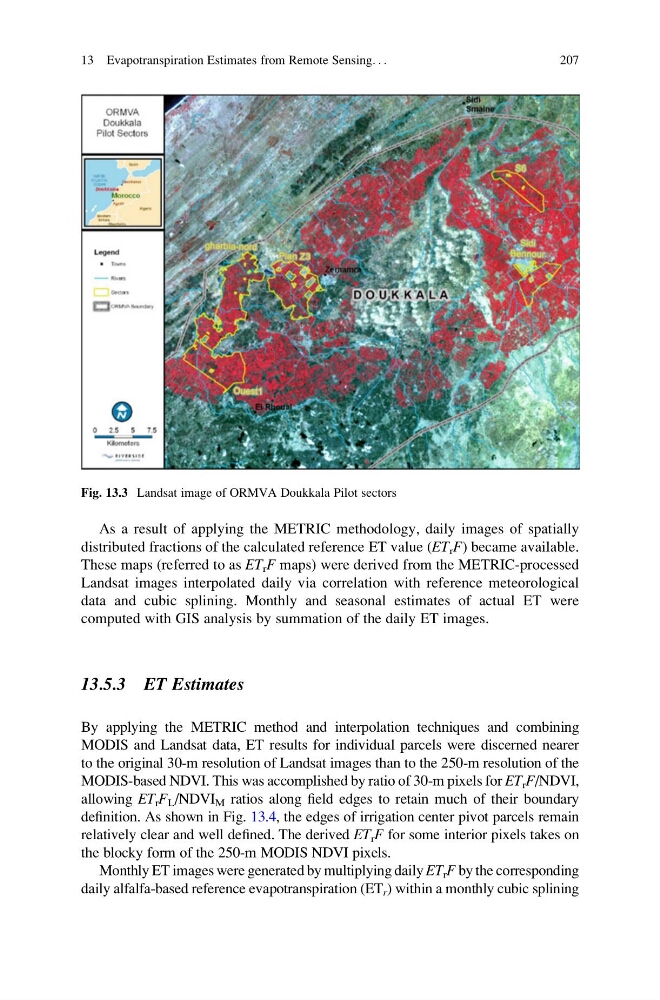
Fig. 13.3 Landsat image of ORMVA Doukkala Pilot sectors
13 Evapotranspiration Estimates from Remote Sensing. . .
207
distributed fractions of the calculated reference ET value (ET r F) became available.
These maps (referred to as ET r F maps) were derived from the METRIC-processed
Landsat images interpolated daily via correlation with reference meteorological
data and cubic splining. Monthly and seasonal estimates of actual ET were
computed with GIS analysis by summation of the daily ET images.
13.5.3 ET Estimates
By applying the METRIC method and interpolation techniques and combining
MODIS and Landsat data, ET results for individual parcels were discerned nearer
to the original 30-m resolution of Landsat images than to the 250-m resolution of the
MODIS-based NDVI. This was accomplished by ratio of 30-m pixels for ET r F/NDVI,
allowing ET r F L /NDVI M ratios along field edges to retain much of their boundary
definition. As shown in Fig. 13.4, the edges of irrigation center pivot parcels remain
relatively clear and well defined. The derived ET r F for some interior pixels takes on
the blocky form of the 250-m MODIS NDVI pixels.
Monthly ET images were generated by multiplying daily ET r F by the corresponding
daily alfalfa-based reference evapotranspiration (ET r ) within a monthly cubic splining
Fig. 13.3 Landsat image of ORMVA Doukkala Pilot sectors
13 Evapotranspiration Estimates from Remote Sensing. . .
207