

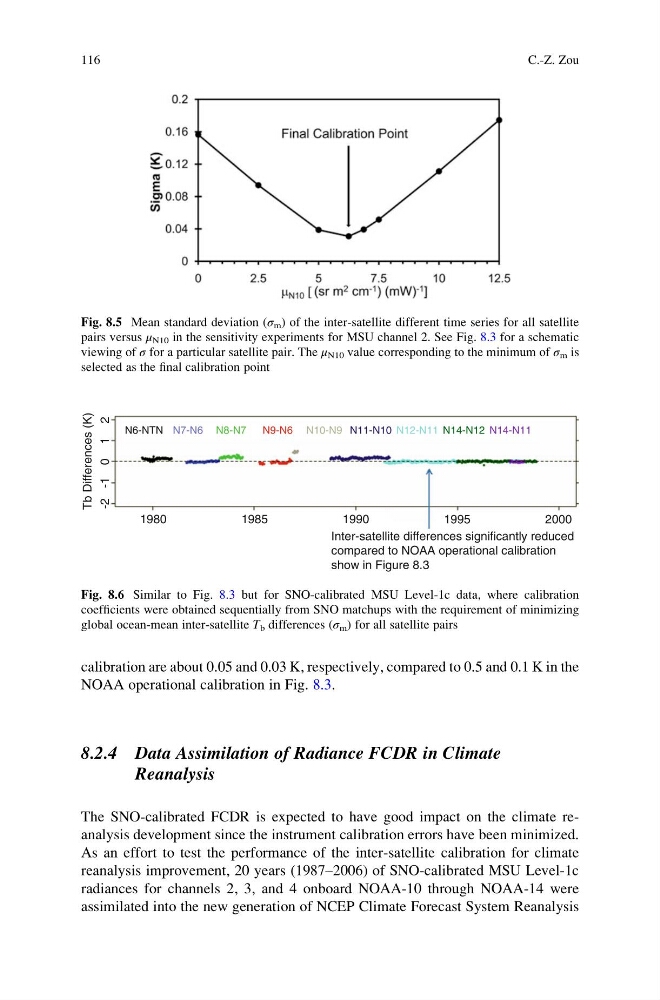
calibration are about 0.05 and 0.03 K, respectively, compared to 0.5 and 0.1 K in the
NOAA operational calibration in Fig. 8.3.
8.2.4 Data Assimilation of Radiance FCDR in Climate
Reanalysis
The SNO-calibrated FCDR is expected to have good impact on the climate reanalysis development since the instrument calibration errors have been minimized.
As an effort to test the performance of the inter-satellite calibration for climate
reanalysis improvement, 20 years (1987–2006) of SNO-calibrated MSU Level-1c
radiances for channels 2, 3, and 4 onboard NOAA-10 through NOAA-14 were
assimilated into the new generation of NCEP Climate Forecast System Reanalysis
Fig. 8.5 Mean standard deviation (σ m ) of the inter-satellite different time series for all satellite
pairs versus μ N10 in the sensitivity experiments for MSU channel 2. See Fig. 8.3 for a schematic
viewing of σ for a particular satellite pair. The μ N10 value corresponding to the minimum of σ m is
selected as the final calibration point
N6-NTN N7-N6 N8-N7
N9-N6 N10-N9 N11-N10 N12-N11 N14-N12 N14-N11
1980
1985
1990
Inter-satellite differences significantly reduced
compared to NOAA operational calibration
show in Figure 8.3
1995
2000
-2 -1 0 1 2
Tb Differences (K)
Fig. 8.6 Similar to Fig. 8.3 but for SNO-calibrated MSU Level-1c data, where calibration
coefficients were obtained sequentially from SNO matchups with the requirement of minimizing
global ocean-mean inter-satellite T b differences (σ m ) for all satellite pairs
116
C.-Z. Zou
NOAA operational calibration in Fig. 8.3.
8.2.4 Data Assimilation of Radiance FCDR in Climate
Reanalysis
The SNO-calibrated FCDR is expected to have good impact on the climate reanalysis development since the instrument calibration errors have been minimized.
As an effort to test the performance of the inter-satellite calibration for climate
reanalysis improvement, 20 years (1987–2006) of SNO-calibrated MSU Level-1c
radiances for channels 2, 3, and 4 onboard NOAA-10 through NOAA-14 were
assimilated into the new generation of NCEP Climate Forecast System Reanalysis
Fig. 8.5 Mean standard deviation (σ m ) of the inter-satellite different time series for all satellite
pairs versus μ N10 in the sensitivity experiments for MSU channel 2. See Fig. 8.3 for a schematic
viewing of σ for a particular satellite pair. The μ N10 value corresponding to the minimum of σ m is
selected as the final calibration point
N6-NTN N7-N6 N8-N7
N9-N6 N10-N9 N11-N10 N12-N11 N14-N12 N14-N11
1980
1985
1990
Inter-satellite differences significantly reduced
compared to NOAA operational calibration
show in Figure 8.3
1995
2000
-2 -1 0 1 2
Tb Differences (K)
Fig. 8.6 Similar to Fig. 8.3 but for SNO-calibrated MSU Level-1c data, where calibration
coefficients were obtained sequentially from SNO matchups with the requirement of minimizing
global ocean-mean inter-satellite T b differences (σ m ) for all satellite pairs
116
C.-Z. Zou