

its implications for the local environment, livelihoods, migration, cropping pattern,
land use pattern related to forest area, grazing lands, and tanks and water availability in the region.
Quantitative information was collected from secondary sources like government
offices at the local level like Nada Kacheri (village-level government office), Gram
Panchayat, Revenue department, Karnataka State Agricultural department, and
Meteorological Department.
Based on the primary and secondary level data, a trend analysis as well as
perception analysis was carried out at the micro level across all the five villages for
assessing the implications of climate change variability.
4 Analysis and Discussion
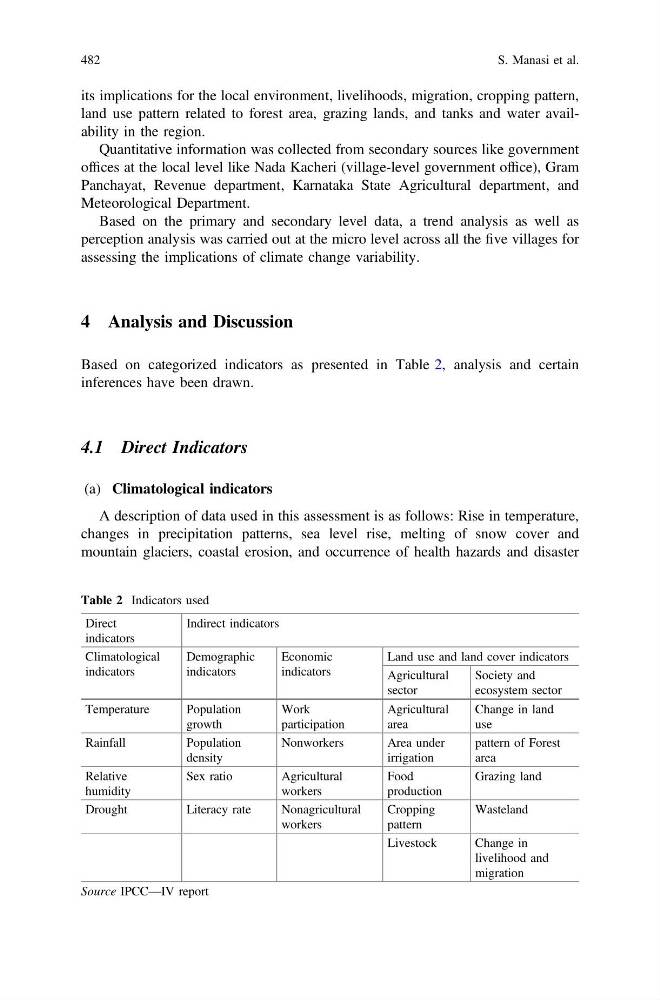
Based on categorized indicators as presented in Table 2, analysis and certain
inferences have been drawn.
4.1 Direct Indicators
(a) Climatological indicators
A description of data used in this assessment is as follows: Rise in temperature,
changes in precipitation patterns, sea level rise, melting of snow cover and
mountain glaciers, coastal erosion, and occurrence of health hazards and disaster
Table 2 Indicators used
Direct
indicators
Indirect indicators
Climatological
indicators
Demographic
indicators
Economic
indicators
Land use and land cover indicators
Agricultural
sector
Society and
ecosystem sector
Temperature
Population
growth
Work
participation
Agricultural
area
Change in land
use
Rainfall
Population
density
Nonworkers
Area under
irrigation
pattern of Forest
area
Relative
humidity
Sex ratio
Agricultural
workers
Food
production
Grazing land
Drought
Literacy rate
Nonagricultural
workers
Cropping
pattern
Wasteland
Livestock
Change in
livelihood and
migration
Source IPCC—IV report
482
S. Manasi et al.
land use pattern related to forest area, grazing lands, and tanks and water availability in the region.
Quantitative information was collected from secondary sources like government
offices at the local level like Nada Kacheri (village-level government office), Gram
Panchayat, Revenue department, Karnataka State Agricultural department, and
Meteorological Department.
Based on the primary and secondary level data, a trend analysis as well as
perception analysis was carried out at the micro level across all the five villages for
assessing the implications of climate change variability.
4 Analysis and Discussion
Based on categorized indicators as presented in Table 2, analysis and certain
inferences have been drawn.
4.1 Direct Indicators
(a) Climatological indicators
A description of data used in this assessment is as follows: Rise in temperature,
changes in precipitation patterns, sea level rise, melting of snow cover and
mountain glaciers, coastal erosion, and occurrence of health hazards and disaster
Table 2 Indicators used
Direct
indicators
Indirect indicators
Climatological
indicators
Demographic
indicators
Economic
indicators
Land use and land cover indicators
Agricultural
sector
Society and
ecosystem sector
Temperature
Population
growth
Work
participation
Agricultural
area
Change in land
use
Rainfall
Population
density
Nonworkers
Area under
irrigation
pattern of Forest
area
Relative
humidity
Sex ratio
Agricultural
workers
Food
production
Grazing land
Drought
Literacy rate
Nonagricultural
workers
Cropping
pattern
Wasteland
Livestock
Change in
livelihood and
migration
Source IPCC—IV report
482
S. Manasi et al.