

3 Result and Discussion
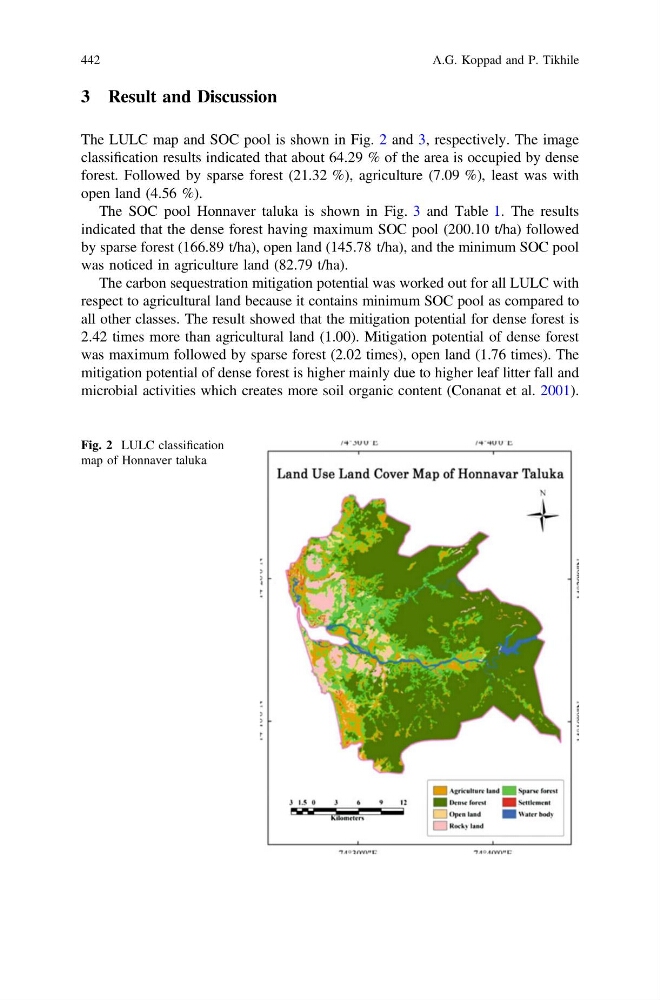
The LULC map and SOC pool is shown in Fig. 2 and 3, respectively. The image
classification results indicated that about 64.29 % of the area is occupied by dense
forest. Followed by sparse forest (21.32 %), agriculture (7.09 %), least was with
open land (4.56 %).
The SOC pool Honnaver taluka is shown in Fig. 3 and Table 1. The results
indicated that the dense forest having maximum SOC pool (200.10 t/ha) followed
by sparse forest (166.89 t/ha), open land (145.78 t/ha), and the minimum SOC pool
was noticed in agriculture land (82.79 t/ha).
The carbon sequestration mitigation potential was worked out for all LULC with
respect to agricultural land because it contains minimum SOC pool as compared to
all other classes. The result showed that the mitigation potential for dense forest is
2.42 times more than agricultural land (1.00). Mitigation potential of dense forest
was maximum followed by sparse forest (2.02 times), open land (1.76 times). The
mitigation potential of dense forest is higher mainly due to higher leaf litter fall and
microbial activities which creates more soil organic content (Conanat et al. 2001).
Fig. 2 LULC classification
map of Honnaver taluka
442
A.G. Koppad and P. Tikhile
The LULC map and SOC pool is shown in Fig. 2 and 3, respectively. The image
classification results indicated that about 64.29 % of the area is occupied by dense
forest. Followed by sparse forest (21.32 %), agriculture (7.09 %), least was with
open land (4.56 %).
The SOC pool Honnaver taluka is shown in Fig. 3 and Table 1. The results
indicated that the dense forest having maximum SOC pool (200.10 t/ha) followed
by sparse forest (166.89 t/ha), open land (145.78 t/ha), and the minimum SOC pool
was noticed in agriculture land (82.79 t/ha).
The carbon sequestration mitigation potential was worked out for all LULC with
respect to agricultural land because it contains minimum SOC pool as compared to
all other classes. The result showed that the mitigation potential for dense forest is
2.42 times more than agricultural land (1.00). Mitigation potential of dense forest
was maximum followed by sparse forest (2.02 times), open land (1.76 times). The
mitigation potential of dense forest is higher mainly due to higher leaf litter fall and
microbial activities which creates more soil organic content (Conanat et al. 2001).
Fig. 2 LULC classification
map of Honnaver taluka
442
A.G. Koppad and P. Tikhile