

followed and representative soil sample was collected. The total 200 soil samples
were collected from different land use. The soil sample to the depth of 1 m was
taken using soil screw auger and core sampler was used to collect the soil core at
different depth for estimating the bulk density. SOC was determined using Walkley
and Black rapid titration method (Walkley and Black 1934). The % of SOC value
obtained from the WB method was multiplied by standard correction factor of 1.32
(De Vos et al. 2007) to obtain the corrected SOC.
SOC % ¼ BTV À STV
ð
ÞÂ0:5 N FAS Â 0:003 Â 100=wt:of soil
Total SOC tones
ð
Þ¼SOC %=100 Ã BD t=m
3
À
Á Ã area m
2
À Á Ã depth of soil m
ð Þ
BTV ¼ Blank titrated value; STV ¼ Sample titrated value;
FAS ¼ Ferrous Ammonium Sulphate
BD ¼ Bulk density:
The results were tested using different statistical techniques such as F-test and
correlation among all samples for the all LULC.
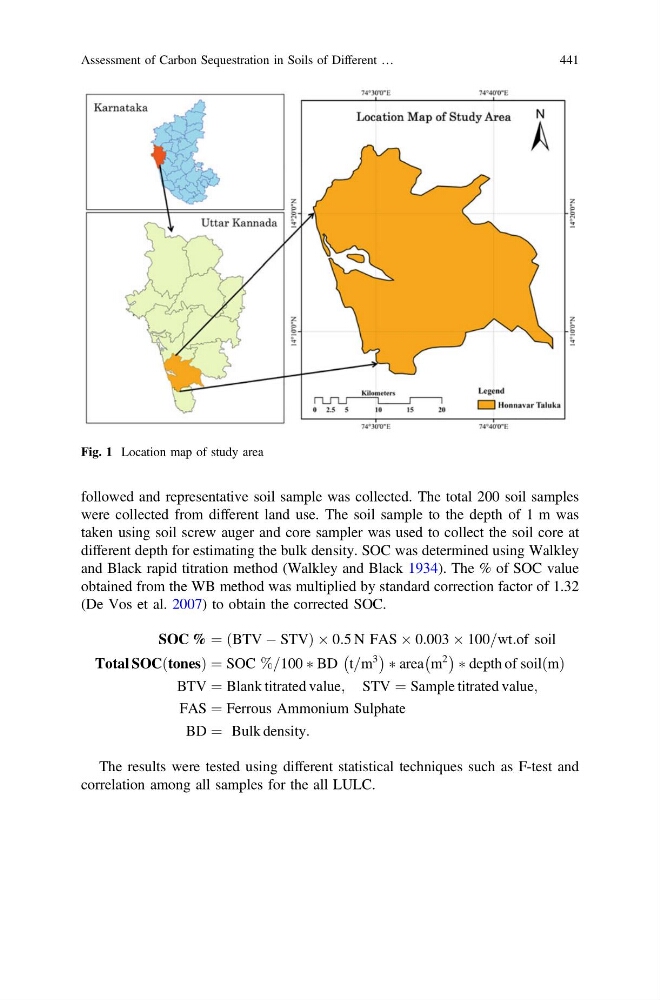
Fig. 1 Location map of study area
Assessment of Carbon Sequestration in Soils of Different …
441
were collected from different land use. The soil sample to the depth of 1 m was
taken using soil screw auger and core sampler was used to collect the soil core at
different depth for estimating the bulk density. SOC was determined using Walkley
and Black rapid titration method (Walkley and Black 1934). The % of SOC value
obtained from the WB method was multiplied by standard correction factor of 1.32
(De Vos et al. 2007) to obtain the corrected SOC.
SOC % ¼ BTV À STV
ð
ÞÂ0:5 N FAS Â 0:003 Â 100=wt:of soil
Total SOC tones
ð
Þ¼SOC %=100 Ã BD t=m
3
À
Á Ã area m
2
À Á Ã depth of soil m
ð Þ
BTV ¼ Blank titrated value; STV ¼ Sample titrated value;
FAS ¼ Ferrous Ammonium Sulphate
BD ¼ Bulk density:
The results were tested using different statistical techniques such as F-test and
correlation among all samples for the all LULC.
Fig. 1 Location map of study area
Assessment of Carbon Sequestration in Soils of Different …
441