

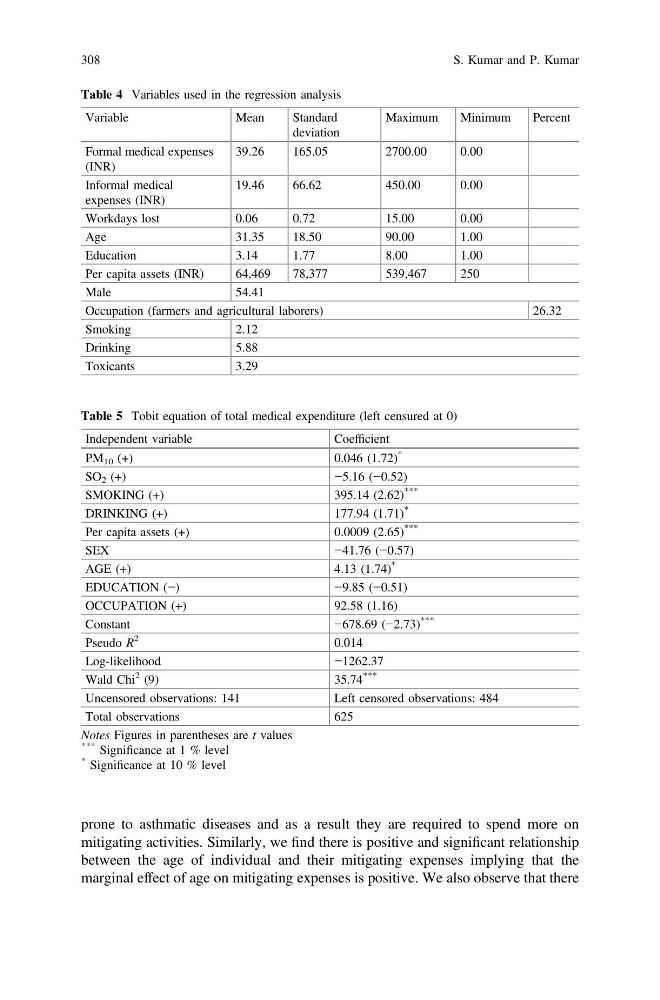
prone to asthmatic diseases and as a result they are required to spend more on
mitigating activities. Similarly, we find there is positive and significant relationship
between the age of individual and their mitigating expenses implying that the
marginal effect of age on mitigating expenses is positive. We also observe that there
Table 5 Tobit equation of total medical expenditure (left censured at 0)
Independent variable
Coefficient
PM 10 (+)
0.046 (1.72)
*
SO 2 (+)
−5.16 (−0.52)
SMOKING (+)
395.14 (2.62)
***
DRINKING (+)
177.94 (1.71)
*
Per capita assets (+)
0.0009 (2.65)
***
SEX
−41.76 (−0.57)
AGE (+)
4.13 (1.74)
*
EDUCATION (−)
−9.85 (−0.51)
OCCUPATION (+)
92.58 (1.16)
Constant
−678.69 (−2.73)
***
Pseudo R
2
0.014
Log-likelihood
−1262.37
Wald Chi
2 (9)
35.74
***
Uncensored observations: 141
Left censored observations: 484
Total observations
625
Notes Figures in parentheses are t values
*** Significance at 1 % level
* Significance at 10 % level
Table 4 Variables used in the regression analysis
Variable
Mean
Standard
deviation
Maximum
Minimum
Percent
Formal medical expenses
(INR)
39.26
165.05
2700.00
0.00
Informal medical
expenses (INR)
19.46
66.62
450.00
0.00
Workdays lost
0.06
0.72
15.00
0.00
Age
31.35
18.50
90.00
1.00
Education
3.14
1.77
8.00
1.00
Per capita assets (INR)
64,469
78,377
539,467
250
Male
54.41
Occupation (farmers and agricultural laborers)
26.32
Smoking
2.12
Drinking
5.88
Toxicants
3.29
308
S. Kumar and P. Kumar
mitigating activities. Similarly, we find there is positive and significant relationship
between the age of individual and their mitigating expenses implying that the
marginal effect of age on mitigating expenses is positive. We also observe that there
Table 5 Tobit equation of total medical expenditure (left censured at 0)
Independent variable
Coefficient
PM 10 (+)
0.046 (1.72)
*
SO 2 (+)
−5.16 (−0.52)
SMOKING (+)
395.14 (2.62)
***
DRINKING (+)
177.94 (1.71)
*
Per capita assets (+)
0.0009 (2.65)
***
SEX
−41.76 (−0.57)
AGE (+)
4.13 (1.74)
*
EDUCATION (−)
−9.85 (−0.51)
OCCUPATION (+)
92.58 (1.16)
Constant
−678.69 (−2.73)
***
Pseudo R
2
0.014
Log-likelihood
−1262.37
Wald Chi
2 (9)
35.74
***
Uncensored observations: 141
Left censored observations: 484
Total observations
625
Notes Figures in parentheses are t values
*** Significance at 1 % level
* Significance at 10 % level
Table 4 Variables used in the regression analysis
Variable
Mean
Standard
deviation
Maximum
Minimum
Percent
Formal medical expenses
(INR)
39.26
165.05
2700.00
0.00
Informal medical
expenses (INR)
19.46
66.62
450.00
0.00
Workdays lost
0.06
0.72
15.00
0.00
Age
31.35
18.50
90.00
1.00
Education
3.14
1.77
8.00
1.00
Per capita assets (INR)
64,469
78,377
539,467
250
Male
54.41
Occupation (farmers and agricultural laborers)
26.32
Smoking
2.12
Drinking
5.88
Toxicants
3.29
308
S. Kumar and P. Kumar