

5 Results from Estimations
As explained earlier, we performed several estimations to assess the impact of
climate change and other characteristics on district output, nonagricultural to begin
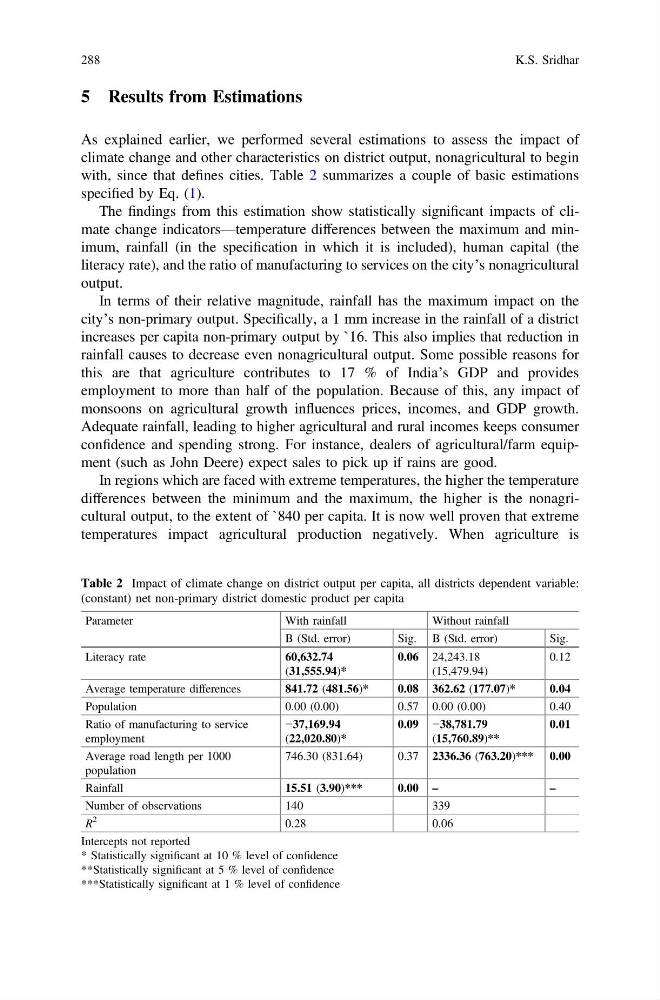
with, since that defines cities. Table 2 summarizes a couple of basic estimations
specified by Eq. (1).
The findings from this estimation show statistically significant impacts of climate change indicators—temperature differences between the maximum and minimum, rainfall (in the specification in which it is included), human capital (the
literacy rate), and the ratio of manufacturing to services on the city’s nonagricultural
output.
In terms of their relative magnitude, rainfall has the maximum impact on the
city’s non-primary output. Specifically, a 1 mm increase in the rainfall of a district
increases per capita non-primary output by `16. This also implies that reduction in
rainfall causes to decrease even nonagricultural output. Some possible reasons for
this are that agriculture contributes to 17 % of India’s GDP and provides
employment to more than half of the population. Because of this, any impact of
monsoons on agricultural growth influences prices, incomes, and GDP growth.
Adequate rainfall, leading to higher agricultural and rural incomes keeps consumer
confidence and spending strong. For instance, dealers of agricultural/farm equipment (such as John Deere) expect sales to pick up if rains are good.
In regions which are faced with extreme temperatures, the higher the temperature
differences between the minimum and the maximum, the higher is the nonagricultural output, to the extent of `840 per capita. It is now well proven that extreme
temperatures impact agricultural production negatively. When agriculture is
Table 2 Impact of climate change on district output per capita, all districts dependent variable:
(constant) net non-primary district domestic product per capita
Parameter
With rainfall
Without rainfall
B (Std. error)
Sig. B (Std. error)
Sig.
Literacy rate
60,632.74
(31,555.94)*
0.06 24,243.18
(15,479.94)
0.12
Average temperature differences
841.72 (481.56)*
0.08 362.62 (177.07)*
0.04
Population
0.00 (0.00)
0.57 0.00 (0.00)
0.40
Ratio of manufacturing to service
employment
−37,169.94
(22,020.80)*
0.09 −38,781.79
(15,760.89)**
0.01
Average road length per 1000
population
746.30 (831.64)
0.37 2336.36 (763.20)*** 0.00
Rainfall
15.51 (3.90)***
0.00 –
–
Number of observations
140
339
R
2
0.28
0.06
Intercepts not reported
* Statistically significant at 10 % level of confidence
**Statistically significant at 5 % level of confidence
***Statistically significant at 1 % level of confidence
288
K.S. Sridhar
As explained earlier, we performed several estimations to assess the impact of
climate change and other characteristics on district output, nonagricultural to begin
with, since that defines cities. Table 2 summarizes a couple of basic estimations
specified by Eq. (1).
The findings from this estimation show statistically significant impacts of climate change indicators—temperature differences between the maximum and minimum, rainfall (in the specification in which it is included), human capital (the
literacy rate), and the ratio of manufacturing to services on the city’s nonagricultural
output.
In terms of their relative magnitude, rainfall has the maximum impact on the
city’s non-primary output. Specifically, a 1 mm increase in the rainfall of a district
increases per capita non-primary output by `16. This also implies that reduction in
rainfall causes to decrease even nonagricultural output. Some possible reasons for
this are that agriculture contributes to 17 % of India’s GDP and provides
employment to more than half of the population. Because of this, any impact of
monsoons on agricultural growth influences prices, incomes, and GDP growth.
Adequate rainfall, leading to higher agricultural and rural incomes keeps consumer
confidence and spending strong. For instance, dealers of agricultural/farm equipment (such as John Deere) expect sales to pick up if rains are good.
In regions which are faced with extreme temperatures, the higher the temperature
differences between the minimum and the maximum, the higher is the nonagricultural output, to the extent of `840 per capita. It is now well proven that extreme
temperatures impact agricultural production negatively. When agriculture is
Table 2 Impact of climate change on district output per capita, all districts dependent variable:
(constant) net non-primary district domestic product per capita
Parameter
With rainfall
Without rainfall
B (Std. error)
Sig. B (Std. error)
Sig.
Literacy rate
60,632.74
(31,555.94)*
0.06 24,243.18
(15,479.94)
0.12
Average temperature differences
841.72 (481.56)*
0.08 362.62 (177.07)*
0.04
Population
0.00 (0.00)
0.57 0.00 (0.00)
0.40
Ratio of manufacturing to service
employment
−37,169.94
(22,020.80)*
0.09 −38,781.79
(15,760.89)**
0.01
Average road length per 1000
population
746.30 (831.64)
0.37 2336.36 (763.20)*** 0.00
Rainfall
15.51 (3.90)***
0.00 –
–
Number of observations
140
339
R
2
0.28
0.06
Intercepts not reported
* Statistically significant at 10 % level of confidence
**Statistically significant at 5 % level of confidence
***Statistically significant at 1 % level of confidence
288
K.S. Sridhar