

The rainfall at the town-level was aggregated at the district-level by aggregating
rainfall data for all towns in the district. This approach suffers from the limitation
that only urban districts are taken into account. We did not have information on
predominantly rural districts which did not have even one town.
The ratio of employment in manufacturing to that in services indicates if the
city’s output is caused by one or the other sector. The ratio of manufacturing to
services was computed for every state from the NSSO and was assumed to be the
same for all districts in a state, given the 2001 town directories did not contain the
manufacturing and service sector employment by town.
Information on coastal districts of India was obtained from the Census of India.
All other districts were assumed as being inland districts (this was confirmed with
the Census).
I use the Census of India’s 2001 town directories for data on rainfall and temperature differences and other socio-economic characteristics for towns and districts, and newly published data by the directorates of Economics and Statistics in
various Indian states for DDP. I obtained a listing of India’s coastal districts from
the Census of India, to enable me to do the estimations separately for coastal and
inland districts.
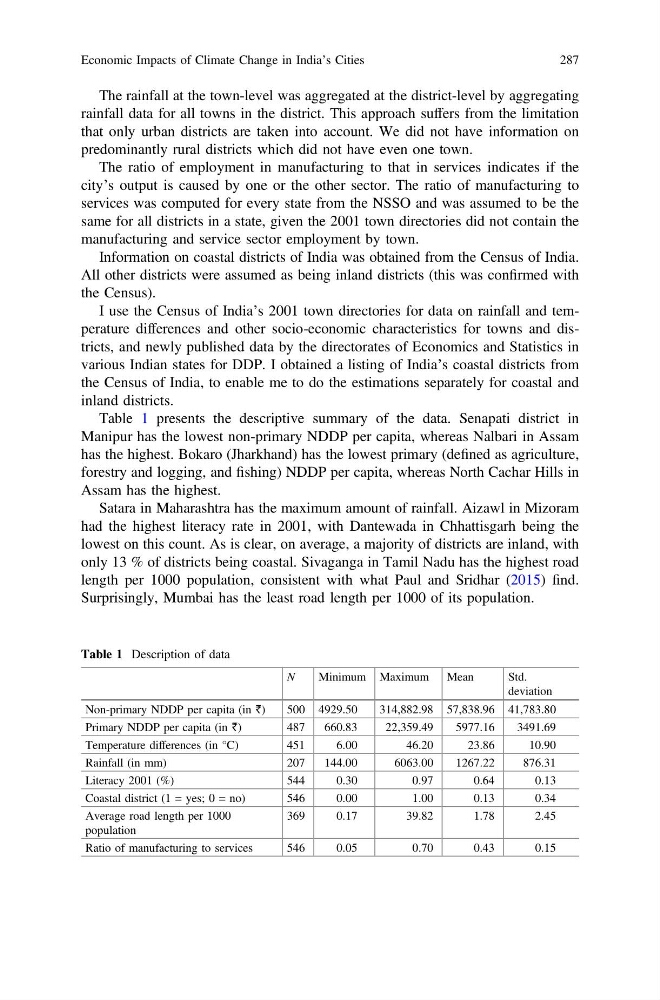
Table 1 presents the descriptive summary of the data. Senapati district in
Manipur has the lowest non-primary NDDP per capita, whereas Nalbari in Assam
has the highest. Bokaro (Jharkhand) has the lowest primary (defined as agriculture,
forestry and logging, and fishing) NDDP per capita, whereas North Cachar Hills in
Assam has the highest.
Satara in Maharashtra has the maximum amount of rainfall. Aizawl in Mizoram
had the highest literacy rate in 2001, with Dantewada in Chhattisgarh being the
lowest on this count. As is clear, on average, a majority of districts are inland, with
only 13 % of districts being coastal. Sivaganga in Tamil Nadu has the highest road
length per 1000 population, consistent with what Paul and Sridhar (2015) find.
Surprisingly, Mumbai has the least road length per 1000 of its population.
Table 1 Description of data
N
Minimum Maximum Mean
Std.
deviation
Non-primary NDDP per capita (in `)
500 4929.50
314,882.98 57,838.96 41,783.80
Primary NDDP per capita (in `)
487
660.83
22,359.49
5977.16
3491.69
Temperature differences (in °C)
451
6.00
46.20
23.86
10.90
Rainfall (in mm)
207
144.00
6063.00
1267.22
876.31
Literacy 2001 (%)
544
0.30
0.97
0.64
0.13
Coastal district (1 = yes; 0 = no)
546
0.00
1.00
0.13
0.34
Average road length per 1000
population
369
0.17
39.82
1.78
2.45
Ratio of manufacturing to services
546
0.05
0.70
0.43
0.15
Economic Impacts of Climate Change in India’s Cities
287
rainfall data for all towns in the district. This approach suffers from the limitation
that only urban districts are taken into account. We did not have information on
predominantly rural districts which did not have even one town.
The ratio of employment in manufacturing to that in services indicates if the
city’s output is caused by one or the other sector. The ratio of manufacturing to
services was computed for every state from the NSSO and was assumed to be the
same for all districts in a state, given the 2001 town directories did not contain the
manufacturing and service sector employment by town.
Information on coastal districts of India was obtained from the Census of India.
All other districts were assumed as being inland districts (this was confirmed with
the Census).
I use the Census of India’s 2001 town directories for data on rainfall and temperature differences and other socio-economic characteristics for towns and districts, and newly published data by the directorates of Economics and Statistics in
various Indian states for DDP. I obtained a listing of India’s coastal districts from
the Census of India, to enable me to do the estimations separately for coastal and
inland districts.
Table 1 presents the descriptive summary of the data. Senapati district in
Manipur has the lowest non-primary NDDP per capita, whereas Nalbari in Assam
has the highest. Bokaro (Jharkhand) has the lowest primary (defined as agriculture,
forestry and logging, and fishing) NDDP per capita, whereas North Cachar Hills in
Assam has the highest.
Satara in Maharashtra has the maximum amount of rainfall. Aizawl in Mizoram
had the highest literacy rate in 2001, with Dantewada in Chhattisgarh being the
lowest on this count. As is clear, on average, a majority of districts are inland, with
only 13 % of districts being coastal. Sivaganga in Tamil Nadu has the highest road
length per 1000 population, consistent with what Paul and Sridhar (2015) find.
Surprisingly, Mumbai has the least road length per 1000 of its population.
Table 1 Description of data
N
Minimum Maximum Mean
Std.
deviation
Non-primary NDDP per capita (in `)
500 4929.50
314,882.98 57,838.96 41,783.80
Primary NDDP per capita (in `)
487
660.83
22,359.49
5977.16
3491.69
Temperature differences (in °C)
451
6.00
46.20
23.86
10.90
Rainfall (in mm)
207
144.00
6063.00
1267.22
876.31
Literacy 2001 (%)
544
0.30
0.97
0.64
0.13
Coastal district (1 = yes; 0 = no)
546
0.00
1.00
0.13
0.34
Average road length per 1000
population
369
0.17
39.82
1.78
2.45
Ratio of manufacturing to services
546
0.05
0.70
0.43
0.15
Economic Impacts of Climate Change in India’s Cities
287