

need to provide training to the farmers as per the resource base of a region to
develop meaningful nonfarm activities. This can go a long way in ameliorating their
distress.
Currently, most farmers do not take up non-farm activities due to lack of
information and resources. Also, it is rather difficult to get credit from formal sector
for such activities without a proper project plan.
9 Conclusion
It is clear from the discussions above that the farmers of Karnataka in its entire
agricultural regions face all the three major types of risks and this is a scenario that
holds for the country as well. Availability of irrigation facilities, however is a
critical element that determines the outcome of a weather related crisis; however,
providence of this facility is rather poor in the state in spite of it being a dry region.
Though risks are all pervasive mitigation strategies are rather weak for the agrarian
community across the nation as can be seen from our analysis of NSSO data at the
all India level and Karnataka experience. In particular, risk mitigation strategies in
terms of crop insurance are highly under developed across the country in general
and also in the state. In this context it is rather interesting to note that in our sample,
around 40 % of the farmers are not interested in crop insurance.
This is because crop insurance is usually area based. Thus, even if a farmer’s
crop is destroyed his/her compensation would depend on whether the area in which
the farmer is cultivating comes under the insurance coverage or not. Therefore, a
farmer feels that he/she may be paying insurance premium unnecessarily. In this
background, it is necessary to take the farmers into confidence while formulating
the insurance policies. What can be the premium related implications of an individual based insurance should also be discussed; otherwise, the entire exercise
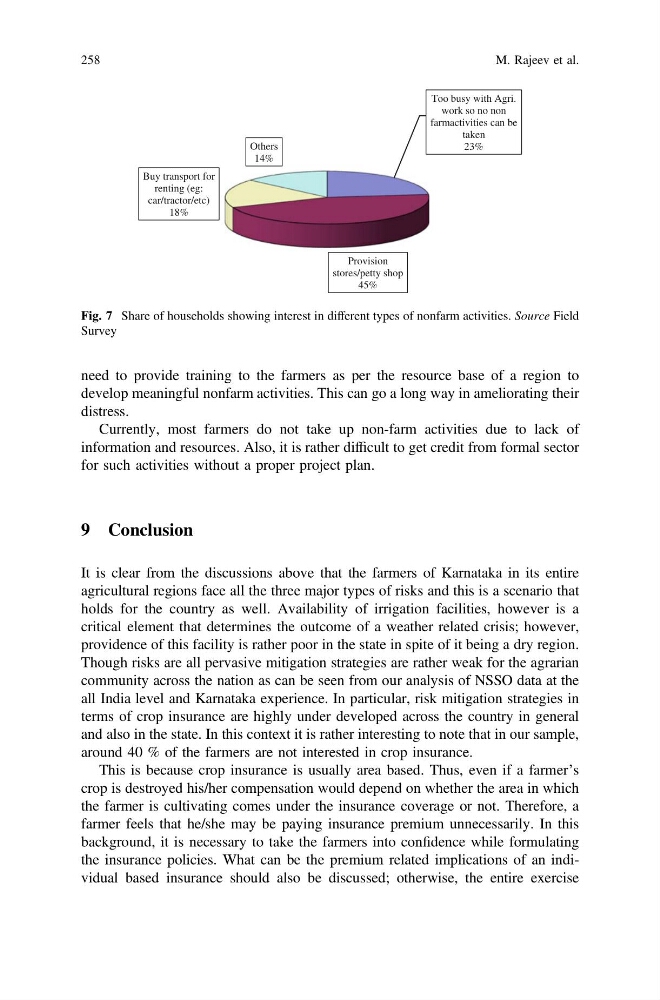
Too busy with Agri.
work so no non
farmactivities can be
taken
23%
Provision
stores/petty shop
45%
Buy transport for
renting (eg:
car/tractor/etc)
18%
Others
14%
Fig. 7 Share of households showing interest in different types of nonfarm activities. Source Field
Survey
258
M. Rajeev et al.
develop meaningful nonfarm activities. This can go a long way in ameliorating their
distress.
Currently, most farmers do not take up non-farm activities due to lack of
information and resources. Also, it is rather difficult to get credit from formal sector
for such activities without a proper project plan.
9 Conclusion
It is clear from the discussions above that the farmers of Karnataka in its entire
agricultural regions face all the three major types of risks and this is a scenario that
holds for the country as well. Availability of irrigation facilities, however is a
critical element that determines the outcome of a weather related crisis; however,
providence of this facility is rather poor in the state in spite of it being a dry region.
Though risks are all pervasive mitigation strategies are rather weak for the agrarian
community across the nation as can be seen from our analysis of NSSO data at the
all India level and Karnataka experience. In particular, risk mitigation strategies in
terms of crop insurance are highly under developed across the country in general
and also in the state. In this context it is rather interesting to note that in our sample,
around 40 % of the farmers are not interested in crop insurance.
This is because crop insurance is usually area based. Thus, even if a farmer’s
crop is destroyed his/her compensation would depend on whether the area in which
the farmer is cultivating comes under the insurance coverage or not. Therefore, a
farmer feels that he/she may be paying insurance premium unnecessarily. In this
background, it is necessary to take the farmers into confidence while formulating
the insurance policies. What can be the premium related implications of an individual based insurance should also be discussed; otherwise, the entire exercise
Too busy with Agri.
work so no non
farmactivities can be
taken
23%
Provision
stores/petty shop
45%
Buy transport for
renting (eg:
car/tractor/etc)
18%
Others
14%
Fig. 7 Share of households showing interest in different types of nonfarm activities. Source Field
Survey
258
M. Rajeev et al.