

output of the other sectors of the economy. On the other hand the thermal electricity
sector requires both energy and non-energy inputs for its production process and
these are supplied by the other production sectors of the economy. If we look at the
column of the thermal electricity sector in our ESAM, we can see that the most of
the non-energy inputs of this sector are supplied from the energy-intensive sector.
Again these energy-intensive sectors are also polluting sectors in the Indian
economy (see Appendix 3). Now the output of these energy-intensive sectors would
increase due to the backward linkage effect of the thermal electricity sector. Hence,
in this way the total environmental pollution in the environment will increase if the
thermal electricity sector expands. In the same way we can also analyse the total
impact of each production sector to the generation of damaging substances.
In the above discussion we have described the output effect on the environmental
pollution. Apart from this output effect there is also income effect on environmental
pollution in India. By income effect we mean the impact on environmental pollution
due to change in household income. Now this income effect on the environmental
pollution can be worked out by estimating the income-pollution multiplier.
3.3 Analysis of Income-Pollution Multiplier
In this study we have estimated the income-pollution multiplier for the household
classes described in our ESAM (see Appendix 1). The estimated income-pollution
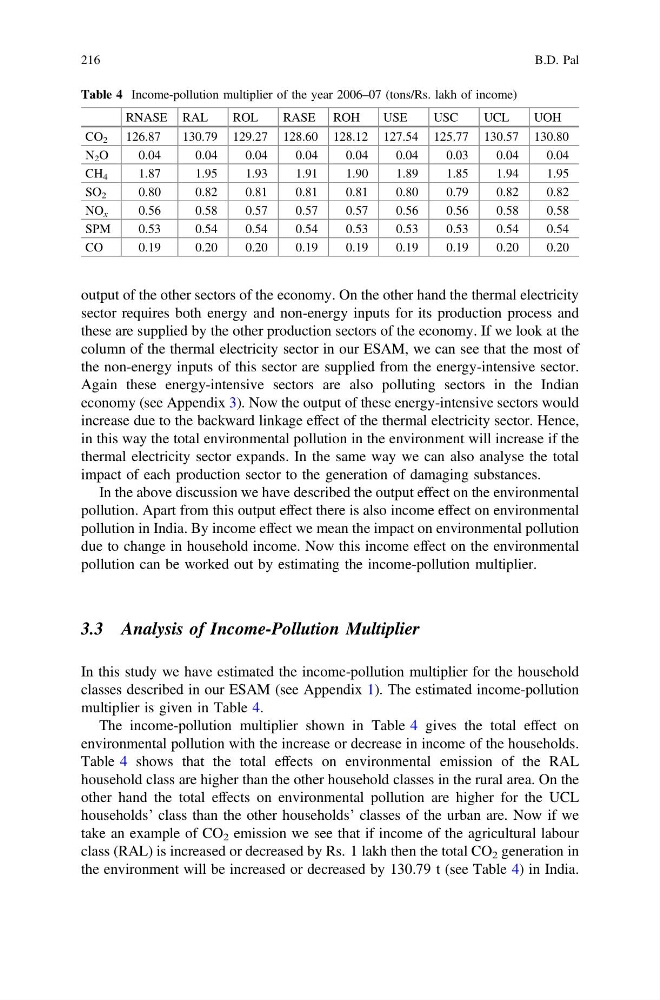
multiplier is given in Table 4.
The income-pollution multiplier shown in Table 4 gives the total effect on
environmental pollution with the increase or decrease in income of the households.
Table 4 shows that the total effects on environmental emission of the RAL
household class are higher than the other household classes in the rural area. On the
other hand the total effects on environmental pollution are higher for the UCL
households’ class than the other households’ classes of the urban are. Now if we
take an example of CO 2 emission we see that if income of the agricultural labour
class (RAL) is increased or decreased by Rs. 1 lakh then the total CO 2 generation in
the environment will be increased or decreased by 130.79 t (see Table 4) in India.
Table 4 Income-pollution multiplier of the year 2006–07 (tons/Rs. lakh of income)
RNASE RAL
ROL
RASE ROH
USE
USC
UCL
UOH
CO 2 126.87
130.79 129.27 128.60 128.12 127.54 125.77 130.57 130.80
N 2 O
0.04
0.04
0.04
0.04
0.04
0.04
0.03
0.04
0.04
CH 4
1.87
1.95
1.93
1.91
1.90
1.89
1.85
1.94
1.95
SO 2
0.80
0.82
0.81
0.81
0.81
0.80
0.79
0.82
0.82
NO x
0.56
0.58
0.57
0.57
0.57
0.56
0.56
0.58
0.58
SPM
0.53
0.54
0.54
0.54
0.53
0.53
0.53
0.54
0.54
CO
0.19
0.20
0.20
0.19
0.19
0.19
0.19
0.20
0.20
216
B.D. Pal
sector requires both energy and non-energy inputs for its production process and
these are supplied by the other production sectors of the economy. If we look at the
column of the thermal electricity sector in our ESAM, we can see that the most of
the non-energy inputs of this sector are supplied from the energy-intensive sector.
Again these energy-intensive sectors are also polluting sectors in the Indian
economy (see Appendix 3). Now the output of these energy-intensive sectors would
increase due to the backward linkage effect of the thermal electricity sector. Hence,
in this way the total environmental pollution in the environment will increase if the
thermal electricity sector expands. In the same way we can also analyse the total
impact of each production sector to the generation of damaging substances.
In the above discussion we have described the output effect on the environmental
pollution. Apart from this output effect there is also income effect on environmental
pollution in India. By income effect we mean the impact on environmental pollution
due to change in household income. Now this income effect on the environmental
pollution can be worked out by estimating the income-pollution multiplier.
3.3 Analysis of Income-Pollution Multiplier
In this study we have estimated the income-pollution multiplier for the household
classes described in our ESAM (see Appendix 1). The estimated income-pollution
multiplier is given in Table 4.
The income-pollution multiplier shown in Table 4 gives the total effect on
environmental pollution with the increase or decrease in income of the households.
Table 4 shows that the total effects on environmental emission of the RAL
household class are higher than the other household classes in the rural area. On the
other hand the total effects on environmental pollution are higher for the UCL
households’ class than the other households’ classes of the urban are. Now if we
take an example of CO 2 emission we see that if income of the agricultural labour
class (RAL) is increased or decreased by Rs. 1 lakh then the total CO 2 generation in
the environment will be increased or decreased by 130.79 t (see Table 4) in India.
Table 4 Income-pollution multiplier of the year 2006–07 (tons/Rs. lakh of income)
RNASE RAL
ROL
RASE ROH
USE
USC
UCL
UOH
CO 2 126.87
130.79 129.27 128.60 128.12 127.54 125.77 130.57 130.80
N 2 O
0.04
0.04
0.04
0.04
0.04
0.04
0.03
0.04
0.04
CH 4
1.87
1.95
1.93
1.91
1.90
1.89
1.85
1.94
1.95
SO 2
0.80
0.82
0.81
0.81
0.81
0.80
0.79
0.82
0.82
NO x
0.56
0.58
0.57
0.57
0.57
0.56
0.56
0.58
0.58
SPM
0.53
0.54
0.54
0.54
0.53
0.53
0.53
0.54
0.54
CO
0.19
0.20
0.20
0.19
0.19
0.19
0.19
0.20
0.20
216
B.D. Pal