

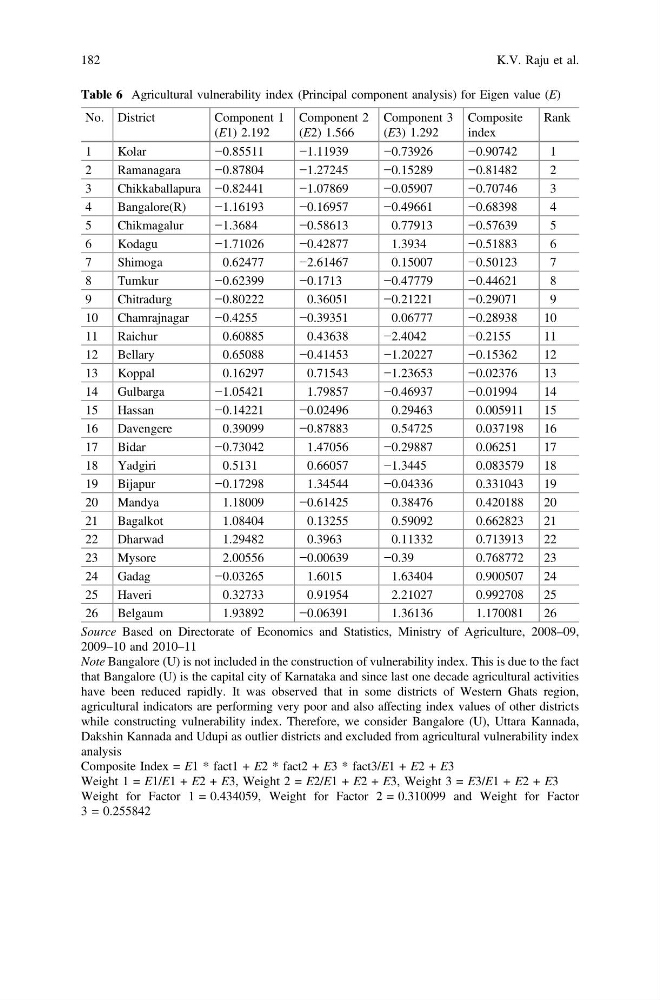
Table 6 Agricultural vulnerability index (Principal component analysis) for Eigen value (E)
No. District
Component 1
(E1) 2.192
Component 2
(E2) 1.566
Component 3
(E3) 1.292
Composite
index
Rank
1
Kolar
−0.85511
−1.11939
−0.73926
−0.90742
1
2
Ramanagara
−0.87804
−1.27245
−0.15289
−0.81482
2
3
Chikkaballapura −0.82441
−1.07869
−0.05907
−0.70746
3
4
Bangalore(R)
−1.16193
−0.16957
−0.49661
−0.68398
4
5
Chikmagalur
−1.3684
−0.58613
0.77913
−0.57639
5
6
Kodagu
−1.71026
−0.42877
1.3934
−0.51883
6
7
Shimoga
0.62477
−2.61467
0.15007
−0.50123
7
8
Tumkur
−0.62399
−0.1713
−0.47779
−0.44621
8
9
Chitradurg
−0.80222
0.36051
−0.21221
−0.29071
9
10
Chamrajnagar
−0.4255
−0.39351
0.06777
−0.28938
10
11
Raichur
0.60885
0.43638
−2.4042
−0.2155
11
12
Bellary
0.65088
−0.41453
−1.20227
−0.15362
12
13
Koppal
0.16297
0.71543
−1.23653
−0.02376
13
14
Gulbarga
−1.05421
1.79857
−0.46937
−0.01994
14
15
Hassan
−0.14221
−0.02496
0.29463
0.005911
15
16
Davengere
0.39099
−0.87883
0.54725
0.037198
16
17
Bidar
−0.73042
1.47056
−0.29887
0.06251
17
18
Yadgiri
0.5131
0.66057
−1.3445
0.083579
18
19
Bijapur
−0.17298
1.34544
−0.04336
0.331043
19
20
Mandya
1.18009
−0.61425
0.38476
0.420188
20
21
Bagalkot
1.08404
0.13255
0.59092
0.662823
21
22
Dharwad
1.29482
0.3963
0.11332
0.713913
22
23
Mysore
2.00556
−0.00639
−0.39
0.768772
23
24
Gadag
−0.03265
1.6015
1.63404
0.900507
24
25
Haveri
0.32733
0.91954
2.21027
0.992708
25
26
Belgaum
1.93892
−0.06391
1.36136
1.170081
26
Source Based on Directorate of Economics and Statistics, Ministry of Agriculture, 2008–09,
2009–10 and 2010–11
Note Bangalore (U) is not included in the construction of vulnerability index. This is due to the fact
that Bangalore (U) is the capital city of Karnataka and since last one decade agricultural activities
have been reduced rapidly. It was observed that in some districts of Western Ghats region,
agricultural indicators are performing very poor and also affecting index values of other districts
while constructing vulnerability index. Therefore, we consider Bangalore (U), Uttara Kannada,
Dakshin Kannada and Udupi as outlier districts and excluded from agricultural vulnerability index
analysis
Composite Index = E1 * fact1 + E2 * fact2 + E3 * fact3/E1 + E2 + E3
Weight 1 = E1/E1 + E2 + E3, Weight 2 = E2/E1 + E2 + E3, Weight 3 = E3/E1 + E2 + E3
Weight for Factor 1 = 0.434059, Weight for Factor 2 = 0.310099 and Weight for Factor
3 = 0.255842
182
K.V. Raju et al.
No. District
Component 1
(E1) 2.192
Component 2
(E2) 1.566
Component 3
(E3) 1.292
Composite
index
Rank
1
Kolar
−0.85511
−1.11939
−0.73926
−0.90742
1
2
Ramanagara
−0.87804
−1.27245
−0.15289
−0.81482
2
3
Chikkaballapura −0.82441
−1.07869
−0.05907
−0.70746
3
4
Bangalore(R)
−1.16193
−0.16957
−0.49661
−0.68398
4
5
Chikmagalur
−1.3684
−0.58613
0.77913
−0.57639
5
6
Kodagu
−1.71026
−0.42877
1.3934
−0.51883
6
7
Shimoga
0.62477
−2.61467
0.15007
−0.50123
7
8
Tumkur
−0.62399
−0.1713
−0.47779
−0.44621
8
9
Chitradurg
−0.80222
0.36051
−0.21221
−0.29071
9
10
Chamrajnagar
−0.4255
−0.39351
0.06777
−0.28938
10
11
Raichur
0.60885
0.43638
−2.4042
−0.2155
11
12
Bellary
0.65088
−0.41453
−1.20227
−0.15362
12
13
Koppal
0.16297
0.71543
−1.23653
−0.02376
13
14
Gulbarga
−1.05421
1.79857
−0.46937
−0.01994
14
15
Hassan
−0.14221
−0.02496
0.29463
0.005911
15
16
Davengere
0.39099
−0.87883
0.54725
0.037198
16
17
Bidar
−0.73042
1.47056
−0.29887
0.06251
17
18
Yadgiri
0.5131
0.66057
−1.3445
0.083579
18
19
Bijapur
−0.17298
1.34544
−0.04336
0.331043
19
20
Mandya
1.18009
−0.61425
0.38476
0.420188
20
21
Bagalkot
1.08404
0.13255
0.59092
0.662823
21
22
Dharwad
1.29482
0.3963
0.11332
0.713913
22
23
Mysore
2.00556
−0.00639
−0.39
0.768772
23
24
Gadag
−0.03265
1.6015
1.63404
0.900507
24
25
Haveri
0.32733
0.91954
2.21027
0.992708
25
26
Belgaum
1.93892
−0.06391
1.36136
1.170081
26
Source Based on Directorate of Economics and Statistics, Ministry of Agriculture, 2008–09,
2009–10 and 2010–11
Note Bangalore (U) is not included in the construction of vulnerability index. This is due to the fact
that Bangalore (U) is the capital city of Karnataka and since last one decade agricultural activities
have been reduced rapidly. It was observed that in some districts of Western Ghats region,
agricultural indicators are performing very poor and also affecting index values of other districts
while constructing vulnerability index. Therefore, we consider Bangalore (U), Uttara Kannada,
Dakshin Kannada and Udupi as outlier districts and excluded from agricultural vulnerability index
analysis
Composite Index = E1 * fact1 + E2 * fact2 + E3 * fact3/E1 + E2 + E3
Weight 1 = E1/E1 + E2 + E3, Weight 2 = E2/E1 + E2 + E3, Weight 3 = E3/E1 + E2 + E3
Weight for Factor 1 = 0.434059, Weight for Factor 2 = 0.310099 and Weight for Factor
3 = 0.255842
182
K.V. Raju et al.