

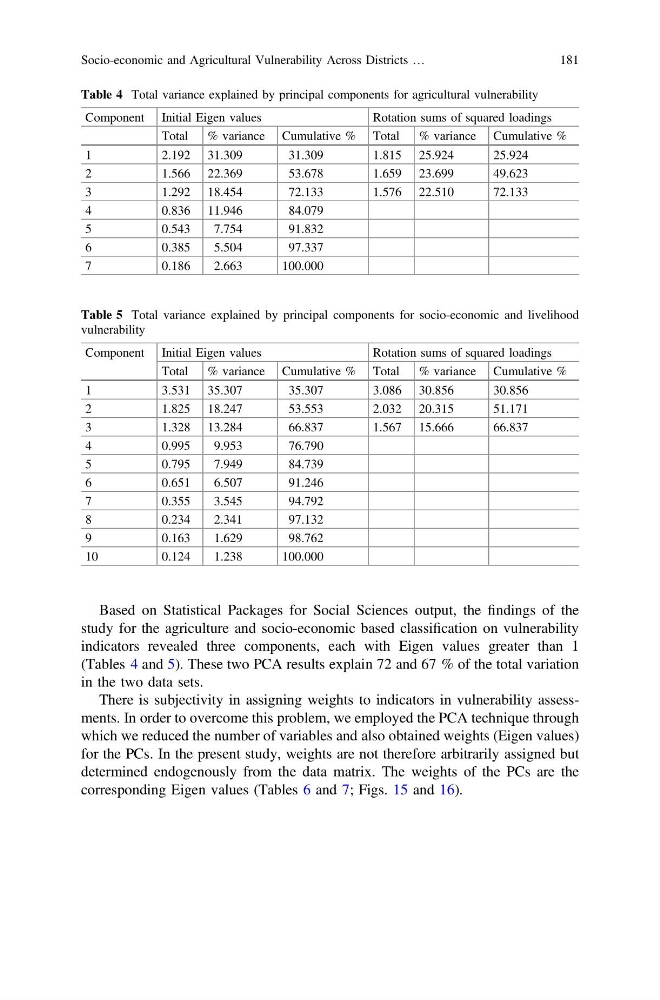
Based on Statistical Packages for Social Sciences output, the findings of the
study for the agriculture and socio-economic based classification on vulnerability
indicators revealed three components, each with Eigen values greater than 1
(Tables 4 and 5). These two PCA results explain 72 and 67 % of the total variation
in the two data sets.
There is subjectivity in assigning weights to indicators in vulnerability assessments. In order to overcome this problem, we employed the PCA technique through
which we reduced the number of variables and also obtained weights (Eigen values)
for the PCs. In the present study, weights are not therefore arbitrarily assigned but
determined endogenously from the data matrix. The weights of the PCs are the
corresponding Eigen values (Tables 6 and 7; Figs. 15 and 16).
Table 4 Total variance explained by principal components for agricultural vulnerability
Component Initial Eigen values
Rotation sums of squared loadings
Total
% variance Cumulative % Total
% variance Cumulative %
1
2.192 31.309
31.309
1.815 25.924
25.924
2
1.566 22.369
53.678
1.659 23.699
49.623
3
1.292 18.454
72.133
1.576 22.510
72.133
4
0.836 11.946
84.079
5
0.543
7.754
91.832
6
0.385
5.504
97.337
7
0.186
2.663
100.000
Table 5 Total variance explained by principal components for socio-economic and livelihood
vulnerability
Component Initial Eigen values
Rotation sums of squared loadings
Total
% variance Cumulative % Total
% variance Cumulative %
1
3.531 35.307
35.307
3.086 30.856
30.856
2
1.825 18.247
53.553
2.032 20.315
51.171
3
1.328 13.284
66.837
1.567 15.666
66.837
4
0.995
9.953
76.790
5
0.795
7.949
84.739
6
0.651
6.507
91.246
7
0.355
3.545
94.792
8
0.234
2.341
97.132
9
0.163
1.629
98.762
10
0.124
1.238
100.000
Socio-economic and Agricultural Vulnerability Across Districts …
181
study for the agriculture and socio-economic based classification on vulnerability
indicators revealed three components, each with Eigen values greater than 1
(Tables 4 and 5). These two PCA results explain 72 and 67 % of the total variation
in the two data sets.
There is subjectivity in assigning weights to indicators in vulnerability assessments. In order to overcome this problem, we employed the PCA technique through
which we reduced the number of variables and also obtained weights (Eigen values)
for the PCs. In the present study, weights are not therefore arbitrarily assigned but
determined endogenously from the data matrix. The weights of the PCs are the
corresponding Eigen values (Tables 6 and 7; Figs. 15 and 16).
Table 4 Total variance explained by principal components for agricultural vulnerability
Component Initial Eigen values
Rotation sums of squared loadings
Total
% variance Cumulative % Total
% variance Cumulative %
1
2.192 31.309
31.309
1.815 25.924
25.924
2
1.566 22.369
53.678
1.659 23.699
49.623
3
1.292 18.454
72.133
1.576 22.510
72.133
4
0.836 11.946
84.079
5
0.543
7.754
91.832
6
0.385
5.504
97.337
7
0.186
2.663
100.000
Table 5 Total variance explained by principal components for socio-economic and livelihood
vulnerability
Component Initial Eigen values
Rotation sums of squared loadings
Total
% variance Cumulative % Total
% variance Cumulative %
1
3.531 35.307
35.307
3.086 30.856
30.856
2
1.825 18.247
53.553
2.032 20.315
51.171
3
1.328 13.284
66.837
1.567 15.666
66.837
4
0.995
9.953
76.790
5
0.795
7.949
84.739
6
0.651
6.507
91.246
7
0.355
3.545
94.792
8
0.234
2.341
97.132
9
0.163
1.629
98.762
10
0.124
1.238
100.000
Socio-economic and Agricultural Vulnerability Across Districts …
181