

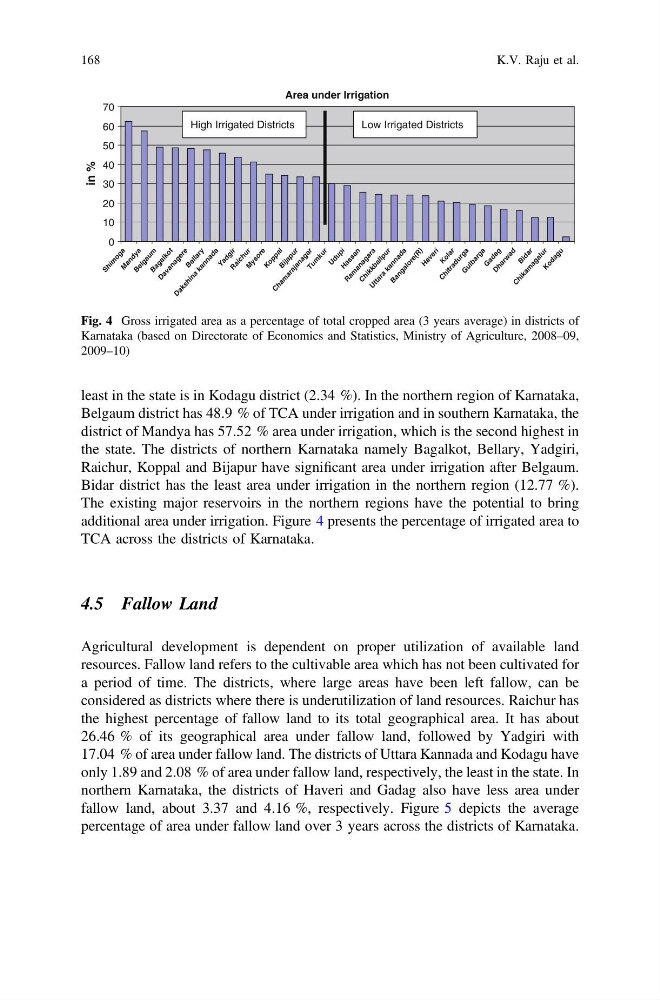
least in the state is in Kodagu district (2.34 %). In the northern region of Karnataka,
Belgaum district has 48.9 % of TCA under irrigation and in southern Karnataka, the
district of Mandya has 57.52 % area under irrigation, which is the second highest in
the state. The districts of northern Karnataka namely Bagalkot, Bellary, Yadgiri,
Raichur, Koppal and Bijapur have significant area under irrigation after Belgaum.
Bidar district has the least area under irrigation in the northern region (12.77 %).
The existing major reservoirs in the northern regions have the potential to bring
additional area under irrigation. Figure 4 presents the percentage of irrigated area to
TCA across the districts of Karnataka.
4.5 Fallow Land
Agricultural development is dependent on proper utilization of available land
resources. Fallow land refers to the cultivable area which has not been cultivated for
a period of time. The districts, where large areas have been left fallow, can be
considered as districts where there is underutilization of land resources. Raichur has
the highest percentage of fallow land to its total geographical area. It has about
26.46 % of its geographical area under fallow land, followed by Yadgiri with
17.04 % of area under fallow land. The districts of Uttara Kannada and Kodagu have
only 1.89 and 2.08 % of area under fallow land, respectively, the least in the state. In
northern Karnataka, the districts of Haveri and Gadag also have less area under
fallow land, about 3.37 and 4.16 %, respectively. Figure 5 depicts the average
percentage of area under fallow land over 3 years across the districts of Karnataka.
Area under Irrigation
0
10
20
30
40
50
60
70
S h im
o g a
M
a n d y a
B e lg
a u m
B a g a lk
o t
D a v a n a g e r e
B e ll a r y
D a k s h in
a
k a n n a d a
Y a d g ir
R a ic
h u r
M
y s o r e
K o p p a l B ij a p u r
C h a m
a r a ja
n a g a r
T u m
k u r
U d u p i H a s s a n
R a m
a n a g a r a
C h ik
k b a ll p u r
U t t a r a
k a n n a d a
B a n g a lo
r e ( R ) H a v e r i
K o la
r
C h it r a d u r g a
G
u lb
a r g a
G
a d a g
D h a r w
a d B id
a r
C h ik
a m
a g a lu
r K o d a g u
in %
High Irrigated Districts
Low Irrigated Districts
Fig. 4 Gross irrigated area as a percentage of total cropped area (3 years average) in districts of
Karnataka (based on Directorate of Economics and Statistics, Ministry of Agriculture, 2008–09,
2009–10)
168
K.V. Raju et al.
Belgaum district has 48.9 % of TCA under irrigation and in southern Karnataka, the
district of Mandya has 57.52 % area under irrigation, which is the second highest in
the state. The districts of northern Karnataka namely Bagalkot, Bellary, Yadgiri,
Raichur, Koppal and Bijapur have significant area under irrigation after Belgaum.
Bidar district has the least area under irrigation in the northern region (12.77 %).
The existing major reservoirs in the northern regions have the potential to bring
additional area under irrigation. Figure 4 presents the percentage of irrigated area to
TCA across the districts of Karnataka.
4.5 Fallow Land
Agricultural development is dependent on proper utilization of available land
resources. Fallow land refers to the cultivable area which has not been cultivated for
a period of time. The districts, where large areas have been left fallow, can be
considered as districts where there is underutilization of land resources. Raichur has
the highest percentage of fallow land to its total geographical area. It has about
26.46 % of its geographical area under fallow land, followed by Yadgiri with
17.04 % of area under fallow land. The districts of Uttara Kannada and Kodagu have
only 1.89 and 2.08 % of area under fallow land, respectively, the least in the state. In
northern Karnataka, the districts of Haveri and Gadag also have less area under
fallow land, about 3.37 and 4.16 %, respectively. Figure 5 depicts the average
percentage of area under fallow land over 3 years across the districts of Karnataka.
Area under Irrigation
0
10
20
30
40
50
60
70
S h im
o g a
M
a n d y a
B e lg
a u m
B a g a lk
o t
D a v a n a g e r e
B e ll a r y
D a k s h in
a
k a n n a d a
Y a d g ir
R a ic
h u r
M
y s o r e
K o p p a l B ij a p u r
C h a m
a r a ja
n a g a r
T u m
k u r
U d u p i H a s s a n
R a m
a n a g a r a
C h ik
k b a ll p u r
U t t a r a
k a n n a d a
B a n g a lo
r e ( R ) H a v e r i
K o la
r
C h it r a d u r g a
G
u lb
a r g a
G
a d a g
D h a r w
a d B id
a r
C h ik
a m
a g a lu
r K o d a g u
in %
High Irrigated Districts
Low Irrigated Districts
Fig. 4 Gross irrigated area as a percentage of total cropped area (3 years average) in districts of
Karnataka (based on Directorate of Economics and Statistics, Ministry of Agriculture, 2008–09,
2009–10)
168
K.V. Raju et al.