

264
M.J. Esteban-Parra, D. POlO-Vazquez, F.S. Rodrigo, Y. Castro-Diez
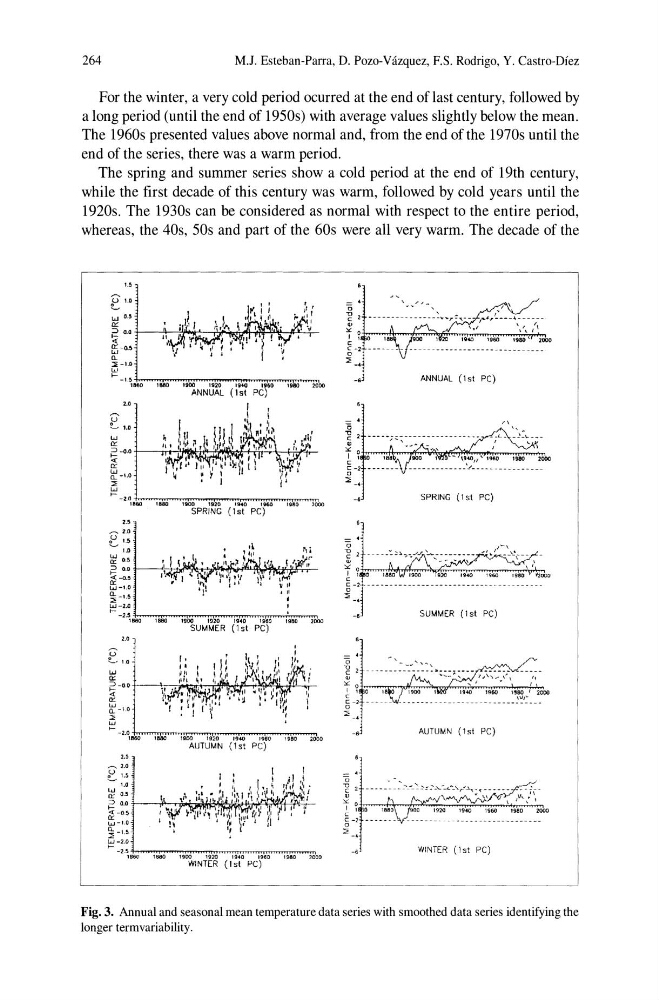
For the winter, a very cold period ocurred at the end of last century, followed by
a long period (until the end of 1950s) with average values slightly below the mean.
The 1960s presented values above normal and, from the end of the 1970s until the
end of the series, there was a warm period.
The spring and summer series show a cold period at the end of 19th century,
while the first decade of this century was warm, followed by cold years until the
1920s. The 1930s can be considered as normal with respect to the entire period,
whereas, the 40s, 50s and part of the 60s were all very warm. The decade of the
.. ,
t'·o
w 0.5
rr:
~ 0.0 t--+--ft",*:!-T.#-mlt'l-ill1P."'I.l-c~+
5-0.5
0..
~-I.P
le'
I- -L~:J...._".,..._"","_..,..,. _ _ ~.,...,.=.,...,.~
Hl60
11380
1900
1920
19&0
21)00
ANNUAL
2.0
fJ
'-' l.il
W
'" 2 -0.0 t---m-T.t'tllt~i'tI~~'fi1:'-r-I;-!-fui"V-«
CI:
~-1.0
' "
~
-2.(1,860
1~
1!i1l~
19'20
.~
19' G6 "rwo rn 1Obo
2.'
2.0
l.'
----.. 2.0
€: 1.5
1.0
~ 0.5
SPRING (1st PC)
~ 0.0 t--*-ry,otJMIr~~~\i-i':fVlIffi-lf"r
C2 -0.5
w-J,O
!~
~-1.5
I
W-2.0
f- -2'~B±60""",":,~"",,,"",":I~,,T""0,,,,~,,To ~'''''''''O ~,"'"To ~=~.
WINTER (1st PC)
- .
o
-g 2
'"
f ~·~·~o~~~~~~~~~~~~~
c
~ ~2
---::> -,
-.
- .
o
~ 2
'" 0
b i
C -2 -
o
::>
- ,
o
ANNUAL (lsi PC)
SPRING (151 PC)
SUMMER (1 sl PC)
~ 2
'I
1 ~±c~~~~~~~~~~--~-+'*"
c _1
o
' "
:J
AUTUMN (lsi PC)
~ 2 -----... -~.:----" .... -':..:::-!'".:'-"---.L .... -"-r .. .1'i-0{"------6III
1.f\~IV~~
1 ~ 0 18BO 900
1940
1960
1980
2000
C _1
o
2_4
WINTER (1 sl PC)
Fig. 3. Annual and seasonal mean temperature data series with smoothed data series identifying the
longer term variability.
M.J. Esteban-Parra, D. POlO-Vazquez, F.S. Rodrigo, Y. Castro-Diez
For the winter, a very cold period ocurred at the end of last century, followed by
a long period (until the end of 1950s) with average values slightly below the mean.
The 1960s presented values above normal and, from the end of the 1970s until the
end of the series, there was a warm period.
The spring and summer series show a cold period at the end of 19th century,
while the first decade of this century was warm, followed by cold years until the
1920s. The 1930s can be considered as normal with respect to the entire period,
whereas, the 40s, 50s and part of the 60s were all very warm. The decade of the
.. ,
t'·o
w 0.5
rr:
~ 0.0 t--+--ft",*:!-T.#-mlt'l-ill1P."'I.l-c~+
5-0.5
0..
~-I.P
le'
I- -L~:J...._".,..._"","_..,..,. _ _ ~.,...,.=.,...,.~
Hl60
11380
1900
1920
19&0
21)00
ANNUAL
2.0
fJ
'-' l.il
W
'" 2 -0.0 t---m-T.t'tllt~i'tI~~'fi1:'-r-I;-!-fui"V-«
CI:
~-1.0
' "
~
-2.(1,860
1~
1!i1l~
19'20
.~
19' G6 "rwo rn 1Obo
2.'
2.0
l.'
----.. 2.0
€: 1.5
1.0
~ 0.5
SPRING (1st PC)
~ 0.0 t--*-ry,otJMIr~~~\i-i':fVlIffi-lf"r
C2 -0.5
w-J,O
!~
~-1.5
I
W-2.0
f- -2'~B±60""",":,~"",,,"",":I~,,T""0,,,,~,,To ~'''''''''O ~,"'"To ~=~.
WINTER (1st PC)
- .
o
-g 2
'"
f ~·~·~o~~~~~~~~~~~~~
c
~ ~2
---::> -,
-.
- .
o
~ 2
'" 0
b i
C -2 -
o
::>
- ,
o
ANNUAL (lsi PC)
SPRING (151 PC)
SUMMER (1 sl PC)
~ 2
'I
1 ~±c~~~~~~~~~~--~-+'*"
c _1
o
' "
:J
AUTUMN (lsi PC)
~ 2 -----... -~.:----" .... -':..:::-!'".:'-"---.L .... -"-r .. .1'i-0{"------6III
1.f\~IV~~
1 ~ 0 18BO 900
1940
1960
1980
2000
C _1
o
2_4
WINTER (1 sl PC)
Fig. 3. Annual and seasonal mean temperature data series with smoothed data series identifying the
longer term variability.