

252
E. Piervitali, M, Colacino
(FigA). The wave of Algiers is in phase opposition with that of Cairo. When the
pressure increases in the Western basin it decreases in the Eastern one and vice
versa. This seesaw characterizes the MO. The index used to define the MO is the
height of 500 hPa surface recorded in Algiers.
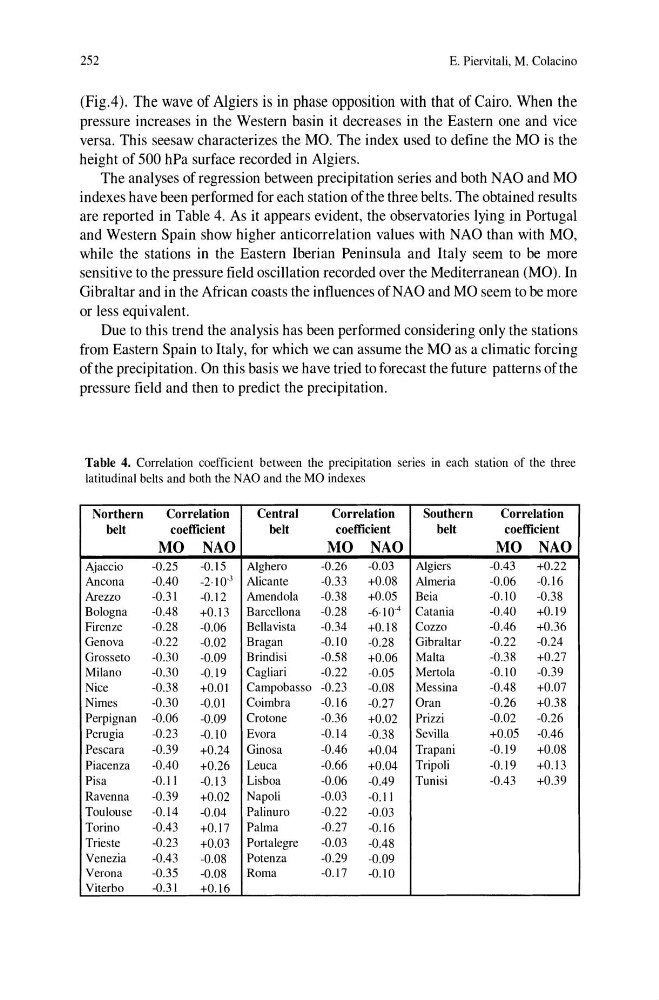
The analyses of regression between precipitation series and both NAO and MO
indexes have been performed for each station of the three belts. The obtained results
are reported in Table 4. As it appears evident, the observatories lying in Portugal
and Western Spain show higher anticorrelation values with NAO than with MO.
while the stations in the Eastern Iberian Peninsula and Italy seem to be more
sensitive to the pressure field oscillation recorded over the Mediterranean (MO). In
Gibraltar and in the African coasts the influences ofNAO and MO seem to be more
or less equivalent.
Due to this trend the analysis has been performed considering only the stations
from Eastern Spain to Italy. for which we can assume the MO as a climatic forcing
of the precipitation. On this basis we have tried to forecast the future patterns of the
pressure field and then to predict the precipitation.
Table 4. Correlation coefficient between the precipitation series in each station of the three
latitudinal belts and both the NAO and the MO indexes
Northern
Correlation
Central
Correlation
Southern
Correlation
belt
coefficient
belt
coefficient
belt
coefficient
MO NAO
MO NAO
MO NAO
Ajaccio
-0.25
-0.15
Alghcro
-0.26
-0.03
Algiers
-0.43
+0.22
Ancona
-0.40
-2.10 3 Alicante
-0.33
+0.08
Almeria
-0.06
-0.16
Arezzo
-0.31
-0.12
Amendola
-0.38
+0.05
Beia
-0.10
-0.38
Bologna
-0.48
+0.13 Barcellona
-0.28
-6.10 4 Catania
-0.40
+0.19
Firenze
-0.28
-0.06
Bellavista
-0.34
+0.18
Cozzo
-0.46
+0.36
Genova
-0.22
-0.02
Bragan
-0.10
-0.28
Gibraltar
-0.22
-0.24
Grosseto
-0.30
-0.09
Brindisi
-0.58
+0.06 Malta
-0.38
+0.27
Milano
-0.30
-0.19
Cagliari
-0.22
-0.05
Mertola
-0.10
-0.39
Nice
-0.38
+0.01 Campobasso -0.23
-0.08
Messina
-0.48
+0.07
Nimes
-0.30
-0.01
Coimbra
-0.16
-0.27
Oran
-0.26
+0.38
Perpignan -0.06
-0.09
Crotone
-0.36
+0.02 Prizzi
-0.02
-0.26
Perugia
-0.23
-0.10
Evora
-0.14
-0.38
Sevilla
+0.05
-0.46
Pescara
-0.39
+0.24 Ginosa
-0.46
+0.04 Trapani
-0.19
+0.08
Piacenza
-0.40
+0.26 Leuca
-0.66
+0.04 Tripoli
-0.19
+0.13
Pisa
-0.11
-0.13
Lisboa
-0.06
-0.49
Tunisi
-0.43
+0.39
Ravenna
-0.39
+0.02 Napoli
-0.03
-0.11
Toulouse
-0.14
-0.04
Palinuro
-0.22
-0.03
Torino
-0.43
+0.17 Palma
-0.27
-0.16
Trieste
-0.23
+0.03 Portalegre
-0.03
-0.48
Venezia
-0.43
-0.08
Potenza
-0.29
-0.09
Verona
-0.35
-0.08
Roma
-0.17
-0.10
Viterbo
-0.31
+0.16
E. Piervitali, M, Colacino
(FigA). The wave of Algiers is in phase opposition with that of Cairo. When the
pressure increases in the Western basin it decreases in the Eastern one and vice
versa. This seesaw characterizes the MO. The index used to define the MO is the
height of 500 hPa surface recorded in Algiers.
The analyses of regression between precipitation series and both NAO and MO
indexes have been performed for each station of the three belts. The obtained results
are reported in Table 4. As it appears evident, the observatories lying in Portugal
and Western Spain show higher anticorrelation values with NAO than with MO.
while the stations in the Eastern Iberian Peninsula and Italy seem to be more
sensitive to the pressure field oscillation recorded over the Mediterranean (MO). In
Gibraltar and in the African coasts the influences ofNAO and MO seem to be more
or less equivalent.
Due to this trend the analysis has been performed considering only the stations
from Eastern Spain to Italy. for which we can assume the MO as a climatic forcing
of the precipitation. On this basis we have tried to forecast the future patterns of the
pressure field and then to predict the precipitation.
Table 4. Correlation coefficient between the precipitation series in each station of the three
latitudinal belts and both the NAO and the MO indexes
Northern
Correlation
Central
Correlation
Southern
Correlation
belt
coefficient
belt
coefficient
belt
coefficient
MO NAO
MO NAO
MO NAO
Ajaccio
-0.25
-0.15
Alghcro
-0.26
-0.03
Algiers
-0.43
+0.22
Ancona
-0.40
-2.10 3 Alicante
-0.33
+0.08
Almeria
-0.06
-0.16
Arezzo
-0.31
-0.12
Amendola
-0.38
+0.05
Beia
-0.10
-0.38
Bologna
-0.48
+0.13 Barcellona
-0.28
-6.10 4 Catania
-0.40
+0.19
Firenze
-0.28
-0.06
Bellavista
-0.34
+0.18
Cozzo
-0.46
+0.36
Genova
-0.22
-0.02
Bragan
-0.10
-0.28
Gibraltar
-0.22
-0.24
Grosseto
-0.30
-0.09
Brindisi
-0.58
+0.06 Malta
-0.38
+0.27
Milano
-0.30
-0.19
Cagliari
-0.22
-0.05
Mertola
-0.10
-0.39
Nice
-0.38
+0.01 Campobasso -0.23
-0.08
Messina
-0.48
+0.07
Nimes
-0.30
-0.01
Coimbra
-0.16
-0.27
Oran
-0.26
+0.38
Perpignan -0.06
-0.09
Crotone
-0.36
+0.02 Prizzi
-0.02
-0.26
Perugia
-0.23
-0.10
Evora
-0.14
-0.38
Sevilla
+0.05
-0.46
Pescara
-0.39
+0.24 Ginosa
-0.46
+0.04 Trapani
-0.19
+0.08
Piacenza
-0.40
+0.26 Leuca
-0.66
+0.04 Tripoli
-0.19
+0.13
Pisa
-0.11
-0.13
Lisboa
-0.06
-0.49
Tunisi
-0.43
+0.39
Ravenna
-0.39
+0.02 Napoli
-0.03
-0.11
Toulouse
-0.14
-0.04
Palinuro
-0.22
-0.03
Torino
-0.43
+0.17 Palma
-0.27
-0.16
Trieste
-0.23
+0.03 Portalegre
-0.03
-0.48
Venezia
-0.43
-0.08
Potenza
-0.29
-0.09
Verona
-0.35
-0.08
Roma
-0.17
-0.10
Viterbo
-0.31
+0.16