

Precipitation scenarios in the Central-Western Mediterranean basin
251
4 Analysis of Correlation Between Precipitation, NAO and
MO
The correlation
analysis between
precipitation and both
NAO and MO has been
performed in order to
investigate about a
climatic forcing of
Mediterranean rainfall.
The NAO is defined
E
,£
r:
0
0
cO
5820
5800
Cairo
5780
5760
5740
5720
Algiers
5700
5680 ~_~ _ _ ~ _______ L_
as the normalized
pressure difference
between two stations,
one lying in Iceland
and other in the Azores
(Van Loon and Rogers,
1978; Jones et aI.,
1997). In the present
1940
1950
1960
1970
1980
1990
2000
year
Fig.3. Pattern of the 500 hPa height in the stations of Algiers and
Cairo, with the superimposed linear trend and the 8 th order
polynomial smoothing
work we have used the
index found on the
home page of the
Climatic Research Unit
(http://www.cru.uea.ac. uk).
5000
4000
3000 :
',"0 l
1000
I
°t
0
5
10
15
20
cycles/sampling interval
25
The MO, less known than
NAO, has been investigated
firstly by Conte et al. (Conte et
aI., 1990). It concerns the pattern
of the 500 hPa surface height
monitored by the soundings in
the stations of Algiers and Cairo,
assumed as representative of the
Western and Eastern basin
respectively. Fig.3 summarizes
the obtained trends. The first one
is increasing and the other one is
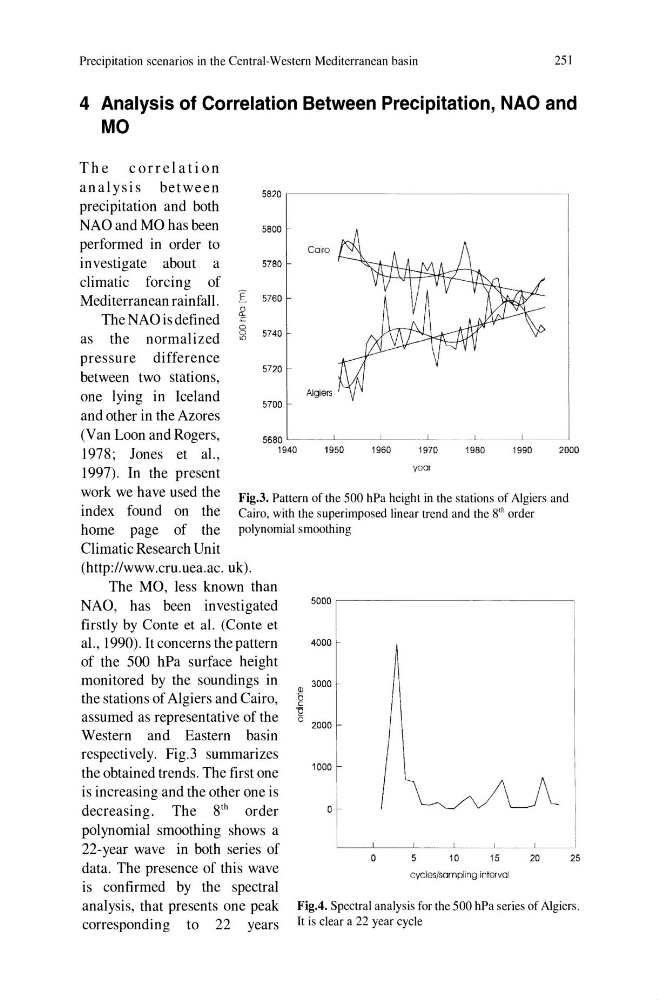
decreasing. The 8 th order
polynomial smoothing shows a
22-year wave in both series of
data. The presence of this wave
is confirmed by the spectral
analysis, that presents one peak
corresponding to 22 years
Fig.4. Spectral analysis for the 500 hPa series of Algiers.
It is clear a 22 year cycle
251
4 Analysis of Correlation Between Precipitation, NAO and
MO
The correlation
analysis between
precipitation and both
NAO and MO has been
performed in order to
investigate about a
climatic forcing of
Mediterranean rainfall.
The NAO is defined
E
,£
r:
0
0
cO
5820
5800
Cairo
5780
5760
5740
5720
Algiers
5700
5680 ~_~ _ _ ~ _______ L_
as the normalized
pressure difference
between two stations,
one lying in Iceland
and other in the Azores
(Van Loon and Rogers,
1978; Jones et aI.,
1997). In the present
1940
1950
1960
1970
1980
1990
2000
year
Fig.3. Pattern of the 500 hPa height in the stations of Algiers and
Cairo, with the superimposed linear trend and the 8 th order
polynomial smoothing
work we have used the
index found on the
home page of the
Climatic Research Unit
(http://www.cru.uea.ac. uk).
5000
4000
3000 :
',"0 l
1000
I
°t
0
5
10
15
20
cycles/sampling interval
25
The MO, less known than
NAO, has been investigated
firstly by Conte et al. (Conte et
aI., 1990). It concerns the pattern
of the 500 hPa surface height
monitored by the soundings in
the stations of Algiers and Cairo,
assumed as representative of the
Western and Eastern basin
respectively. Fig.3 summarizes
the obtained trends. The first one
is increasing and the other one is
decreasing. The 8 th order
polynomial smoothing shows a
22-year wave in both series of
data. The presence of this wave
is confirmed by the spectral
analysis, that presents one peak
corresponding to 22 years
Fig.4. Spectral analysis for the 500 hPa series of Algiers.
It is clear a 22 year cycle