

234
I~ ~--~--~--------------~
t
~ 120
6 ~~~~--~~~--------~
r
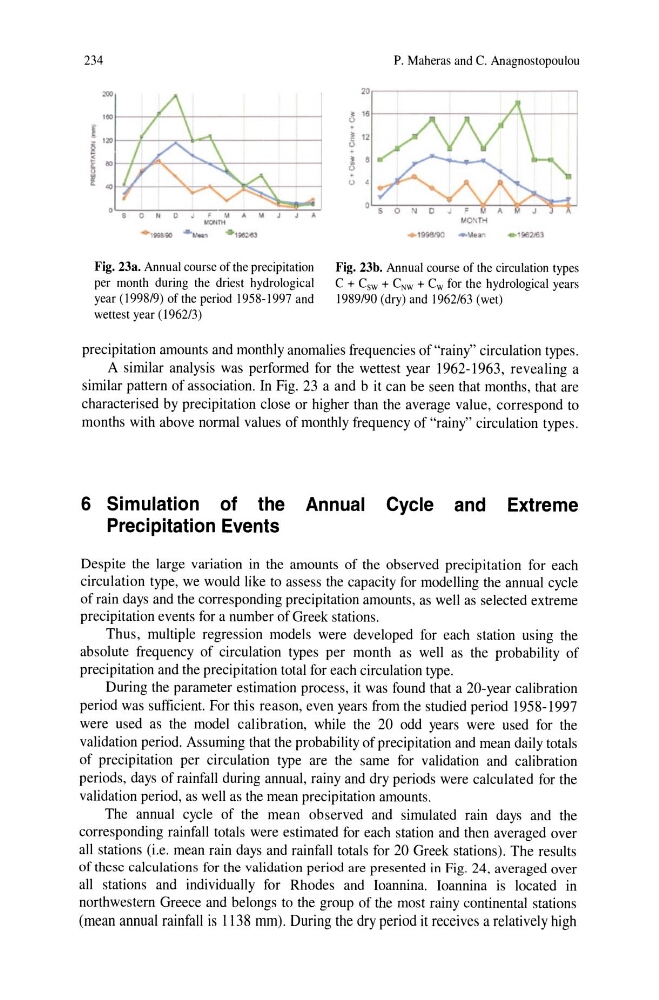
Fig. 23a. Annual course of the precipitation
per month during the driest hydrological
year (1998/9) of the period 1958-1997 and
wettest year (1962/3)
P. Maheras and C. Anagnostopoulou
20,---------------------------,
~ 15 r-----~~~~--_T~----~
.
~ 12
o
Fig. 23b. Annual course of the circulation types
C + Csw + CNW + Cw for the hydrological years
1989/90 (dry) and 1962/63 (wet)
precipitation amounts and monthly anomalies frequencies of "rainy" circulation types.
A similar analysis was performed for the wettest year 1962-1963, revealing a
similar pattern of association. In Fig. 23 a and b it can be seen that months, that are
characterised by precipitation close or higher than the average value, correspond to
months with above normal values of monthly frequency of "rainy" circulation types.
6 Simulation of the Annual Cycle and Extreme
Precipitation Events
Despite the large variation in the amounts of the observed precipitation for each
circulation type, we would like to assess the capacity for modelling the annual cycle
of rain days and the corresponding precipitation amounts, as well as selected extreme
precipitation events for a number of Greek stations.
Thus, multiple regression models were developed for each station using the
absolute frequency of circulation types per month as well as the probability of
precipitation and the precipitation total for each circulation type.
During the parameter estimation process, it was found that a 20-year calibration
period was sufficient. For this reason, even years from the studied period 1958-1997
were used as the model calibration, while the 20 odd years were used for the
validation period. Assuming that the probability of precipitation and mean daily totals
of precipitation per circulation type are the same for validation and calibration
periods, days of rainfall during annual, rainy and dry periods were calculated for the
validation period, as well as the mean precipitation amounts.
The annual cycle of the mean observed and simulated rain days and the
corresponding rainfall totals were estimated for each station and then averaged over
all stations (i.e. mean rain days and rainfall totals for 20 Greek stations). The results
of these calculations for the validation period are presented in Fig. 24, averaged over
all stations and individually for Rhodes and Ioannina. Ioannina is located in
northwestern Greece and belongs to the group of the most rainy continental stations
(mean annual rainfall is 1138 mm). During the dry period it receives a relatively high
I~ ~--~--~--------------~
t
~ 120
6 ~~~~--~~~--------~
r
Fig. 23a. Annual course of the precipitation
per month during the driest hydrological
year (1998/9) of the period 1958-1997 and
wettest year (1962/3)
P. Maheras and C. Anagnostopoulou
20,---------------------------,
~ 15 r-----~~~~--_T~----~
.
~ 12
o
Fig. 23b. Annual course of the circulation types
C + Csw + CNW + Cw for the hydrological years
1989/90 (dry) and 1962/63 (wet)
precipitation amounts and monthly anomalies frequencies of "rainy" circulation types.
A similar analysis was performed for the wettest year 1962-1963, revealing a
similar pattern of association. In Fig. 23 a and b it can be seen that months, that are
characterised by precipitation close or higher than the average value, correspond to
months with above normal values of monthly frequency of "rainy" circulation types.
6 Simulation of the Annual Cycle and Extreme
Precipitation Events
Despite the large variation in the amounts of the observed precipitation for each
circulation type, we would like to assess the capacity for modelling the annual cycle
of rain days and the corresponding precipitation amounts, as well as selected extreme
precipitation events for a number of Greek stations.
Thus, multiple regression models were developed for each station using the
absolute frequency of circulation types per month as well as the probability of
precipitation and the precipitation total for each circulation type.
During the parameter estimation process, it was found that a 20-year calibration
period was sufficient. For this reason, even years from the studied period 1958-1997
were used as the model calibration, while the 20 odd years were used for the
validation period. Assuming that the probability of precipitation and mean daily totals
of precipitation per circulation type are the same for validation and calibration
periods, days of rainfall during annual, rainy and dry periods were calculated for the
validation period, as well as the mean precipitation amounts.
The annual cycle of the mean observed and simulated rain days and the
corresponding rainfall totals were estimated for each station and then averaged over
all stations (i.e. mean rain days and rainfall totals for 20 Greek stations). The results
of these calculations for the validation period are presented in Fig. 24, averaged over
all stations and individually for Rhodes and Ioannina. Ioannina is located in
northwestern Greece and belongs to the group of the most rainy continental stations
(mean annual rainfall is 1138 mm). During the dry period it receives a relatively high