

49
A
G
R
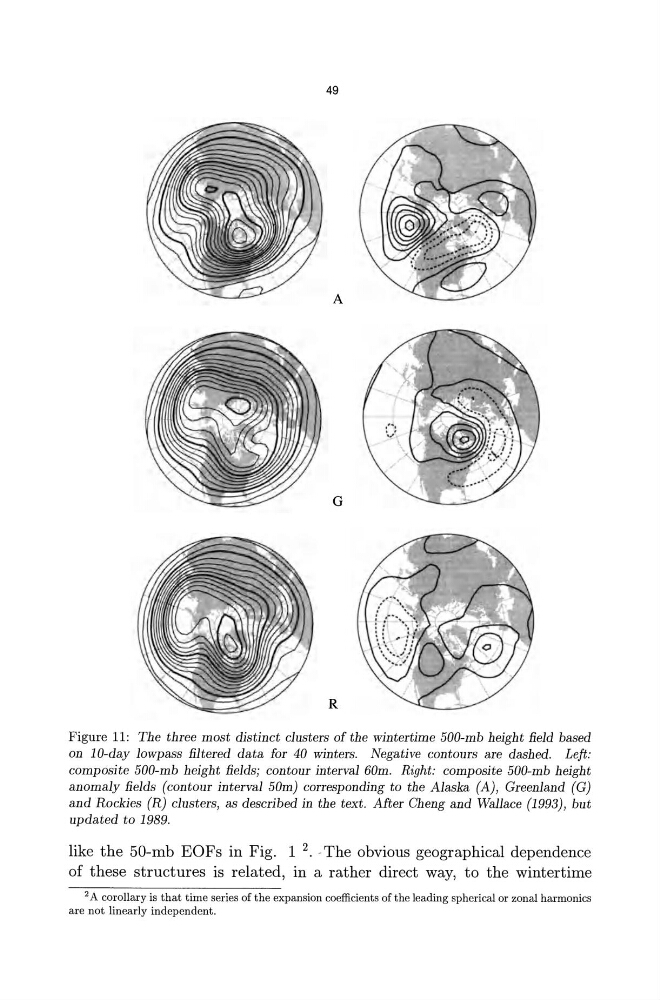
Figure 11: The three most distinct clusters of the wintertime 500-mb height field based
on lO-day lowpass filtered data for 40 winters. Negative contours are dashed. Left:
composite 500-mb height fields; contour interval 60m. Right: composite 500-mb height
anomaly fields (contour interval 50m) corresponding to the Alaska (A), Greenland (G)
and Rockies (R) clusters, as described in the text. After Cheng and Wallace (1993), but
updated to 1989.
like the 50-mb EOFs in Fig. 1 2. The obvious geographical dependence
of these structures is related, in a rather direct way, to the wintertime
2 A corollary is that time series of the expansion coefficients of the leading spherical or zonal harmonics
are not linearly independent.
A
G
R
Figure 11: The three most distinct clusters of the wintertime 500-mb height field based
on lO-day lowpass filtered data for 40 winters. Negative contours are dashed. Left:
composite 500-mb height fields; contour interval 60m. Right: composite 500-mb height
anomaly fields (contour interval 50m) corresponding to the Alaska (A), Greenland (G)
and Rockies (R) clusters, as described in the text. After Cheng and Wallace (1993), but
updated to 1989.
like the 50-mb EOFs in Fig. 1 2. The obvious geographical dependence
of these structures is related, in a rather direct way, to the wintertime
2 A corollary is that time series of the expansion coefficients of the leading spherical or zonal harmonics
are not linearly independent.