

45
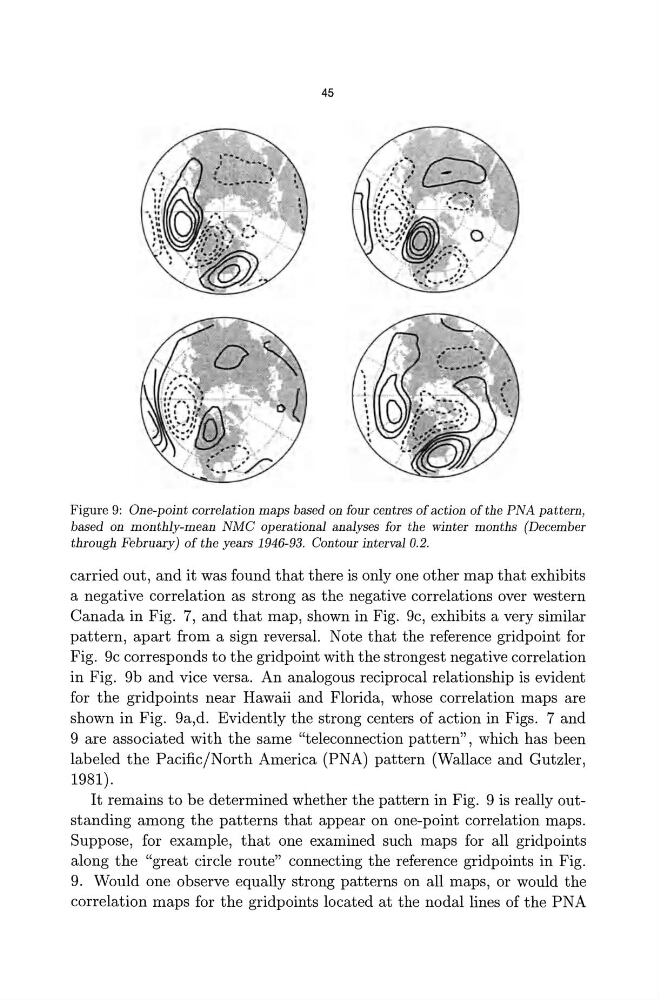
Figure 9: One-point correlation maps based on four centres of action of the PNA pattern,
based on monthly-mean NMC operational analyses for the winter months (December
through February) of the years 1946-93. Contour interval 0.2.
carried out, and it was found that there is only one other map that exhibits
a negative correlation as strong as the negative correlations over western
Canada in Fig. 7, and that map, shown in Fig. gc, exhibits a very similar
pattern, apart from a sign reversal. Note that the reference gridpoint for
Fig. 9c corresponds to the gridpoint with the strongest negative correlation
in Fig. 9b and vice versa. An analogous reciprocal relationship is evident
for the grid points near Hawaii and Florida, whose correlation maps are
shown in Fig. 9a,d. Evidently the strong centers of action in Figs. 7 and
9 are associated with the same "teleconnection pattern", which has been
labeled the Pacific/North America (PNA) pattern (Wallace and Gutzler,
1981).
It remains to be determined whether the pattern in Fig. 9 is really outstanding among the patterns that appear on one-point correlation maps.
Suppose, for example, that one examined such maps for all gridpoints
along the "great circle route" connecting the reference gridpoints in Fig.
9. Would one observe equally strong patterns on all maps, or would the
correlation maps for the gridpoints located at the nodal lines of the PN A
Figure 9: One-point correlation maps based on four centres of action of the PNA pattern,
based on monthly-mean NMC operational analyses for the winter months (December
through February) of the years 1946-93. Contour interval 0.2.
carried out, and it was found that there is only one other map that exhibits
a negative correlation as strong as the negative correlations over western
Canada in Fig. 7, and that map, shown in Fig. gc, exhibits a very similar
pattern, apart from a sign reversal. Note that the reference gridpoint for
Fig. 9c corresponds to the gridpoint with the strongest negative correlation
in Fig. 9b and vice versa. An analogous reciprocal relationship is evident
for the grid points near Hawaii and Florida, whose correlation maps are
shown in Fig. 9a,d. Evidently the strong centers of action in Figs. 7 and
9 are associated with the same "teleconnection pattern", which has been
labeled the Pacific/North America (PNA) pattern (Wallace and Gutzler,
1981).
It remains to be determined whether the pattern in Fig. 9 is really outstanding among the patterns that appear on one-point correlation maps.
Suppose, for example, that one examined such maps for all gridpoints
along the "great circle route" connecting the reference gridpoints in Fig.
9. Would one observe equally strong patterns on all maps, or would the
correlation maps for the gridpoints located at the nodal lines of the PN A