

459
0.0
0.1
0.2
0.3
0.4
0.5
Frequency (cycles/month)
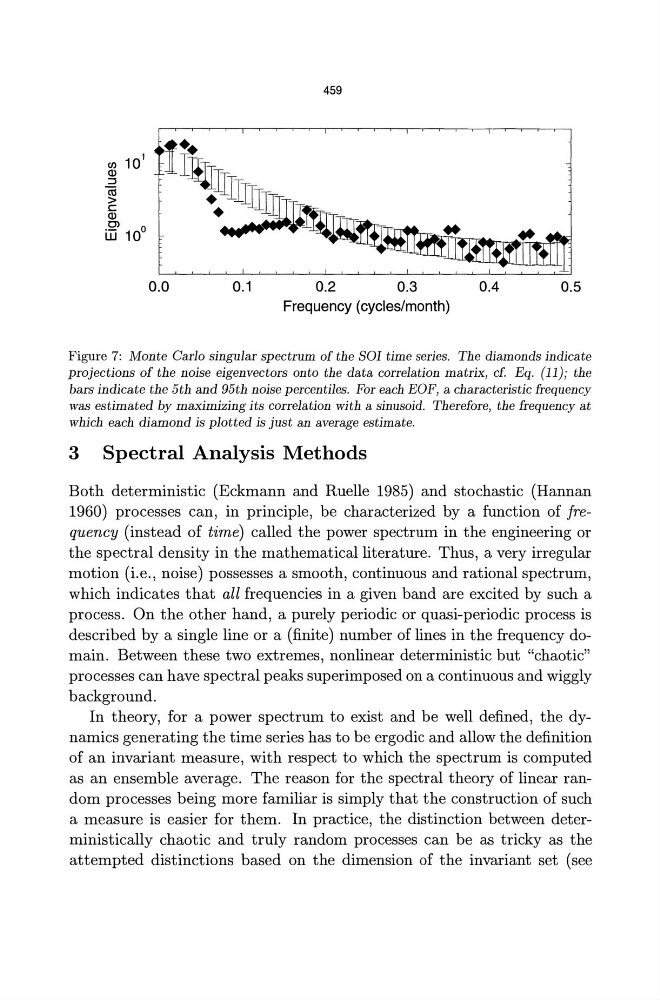
Figure 7: Monte Carlo singular spectrum of the SOl time series. The diamonds indicate
projections of the noise eigenvectors onto the data correlation matrix, cf Eq. (11); the
bars indicate the 5th and 95th noise percentiles. For each EOF, a characteristic frequency
was estimated by maximizing its correlation with a sinusoid. Therefore, the frequency at
which each diamond is plotted is just an average estimate.
3 Spectral Analysis Methods
Both deterministic (Eckmann and Ruelle 1985) and stochastic (Hannan
1960) processes can, in principle, be characterized by a function of frequency (instead of time) called the power spectrum in the engineering or
the spectral density in the mathematical literature. Thus, a very irregular
motion (i.e., noise) possesses a smooth, continuous and rational spectrum,
which indicates that all frequencies in a given band are excited by such a
process. On the other hand, a purely periodic or quasi-periodic process is
described by a single line or a (finite) number of lines in the frequency domain. Between these two extremes, nonlinear deterministic but "chaotic"
processes can have spectral peaks superimposed on a continuous and wiggly
background.
In theory, for a power spectrum to exist and be well defined, the dynamics generating the time series has to be ergodic and allow the definition
of an invariant measure, with respect to which the spectrum is computed
as an ensemble average. The reason for the spectral theory of linear random processes being more familiar is simply that the construction of such
a measure is easier for them. In practice, the distinction between deterministically chaotic and truly random processes can be as tricky as the
attempted distinctions based on the dimension of the invariant set (see
0.0
0.1
0.2
0.3
0.4
0.5
Frequency (cycles/month)
Figure 7: Monte Carlo singular spectrum of the SOl time series. The diamonds indicate
projections of the noise eigenvectors onto the data correlation matrix, cf Eq. (11); the
bars indicate the 5th and 95th noise percentiles. For each EOF, a characteristic frequency
was estimated by maximizing its correlation with a sinusoid. Therefore, the frequency at
which each diamond is plotted is just an average estimate.
3 Spectral Analysis Methods
Both deterministic (Eckmann and Ruelle 1985) and stochastic (Hannan
1960) processes can, in principle, be characterized by a function of frequency (instead of time) called the power spectrum in the engineering or
the spectral density in the mathematical literature. Thus, a very irregular
motion (i.e., noise) possesses a smooth, continuous and rational spectrum,
which indicates that all frequencies in a given band are excited by such a
process. On the other hand, a purely periodic or quasi-periodic process is
described by a single line or a (finite) number of lines in the frequency domain. Between these two extremes, nonlinear deterministic but "chaotic"
processes can have spectral peaks superimposed on a continuous and wiggly
background.
In theory, for a power spectrum to exist and be well defined, the dynamics generating the time series has to be ergodic and allow the definition
of an invariant measure, with respect to which the spectrum is computed
as an ensemble average. The reason for the spectral theory of linear random processes being more familiar is simply that the construction of such
a measure is easier for them. In practice, the distinction between deterministically chaotic and truly random processes can be as tricky as the
attempted distinctions based on the dimension of the invariant set (see