

416
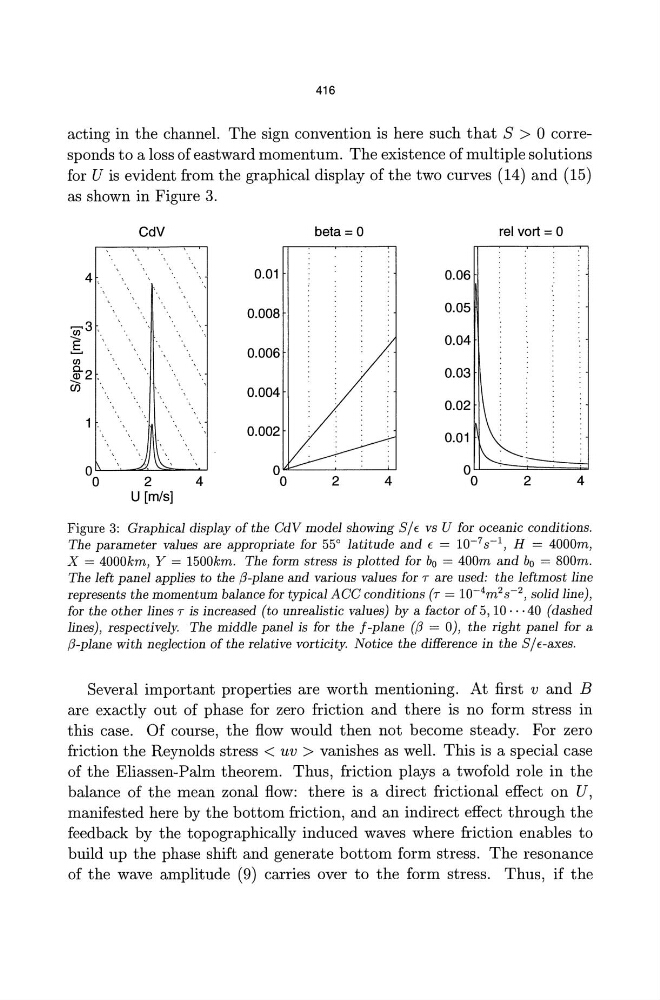
acting in the channel. The sign convention is here such that S > 0 corresponds to a loss of eastward momentum. The existence of multiple solutions
for U is evident from the graphical display of the two curves (14) and (15)
as shown in Figure 3.
CdV
4
.:t.~,
o '-'----~-"""'__'>=-_....J
0 2 4
U [m/s]
beta = 0
0.01
0.008
0.006
0.004
0.002
2
rei vort = 0
0.06
0.05
0.04
0.03
0.02
0.01
0
I~
4
0
2
4
Figure 3: Graphical display of the CdV model showing Sit vs U for oceanic conditions.
The parameter values are appropriate for 55° latitude and t = 10- 7 8- 1 , H = 4000m,
X = 4000km, Y = 1500km. The form stress is plotted for bo = 400m and bo = 800m.
The left panel applies to the ;3-plane and various values for T are used: the leftmost line
represents the momentum balance for typical ACC conditions (T = 10-4m 2 8- 2 , solid line),
for the other lines T is increased (to unrealistic values) by a factor of 5,10· . ·40 (dashed
lines), respectively. The middle panel is for the J-plane (;3 = 0), the right panel for a
;3-plane with neglection of the relative vorticity. Notice the difference in the Sit-axes.
Several important properties are worth mentioning. At first v and B
are exactly out of phase for zero friction and there is no form stress in
this case. Of course, the flow would then not become steady. For zero
friction the Reynolds stress < uv > vanishes as well. This is a special case
of the Eliassen-Palm theorem. Thus, friction plays a twofold role in the
balance of the mean zonal flow: there is a direct frictional effect on U,
manifested here by the bottom friction, and an indirect effect through the
feedback by the topographically induced waves where friction enables to
build up the phase shift and generate bottom form stress. The resonance
of the wave amplitude (9) carries over to the form stress. Thus, if the
acting in the channel. The sign convention is here such that S > 0 corresponds to a loss of eastward momentum. The existence of multiple solutions
for U is evident from the graphical display of the two curves (14) and (15)
as shown in Figure 3.
CdV
4
.:t.~,
o '-'----~-"""'__'>=-_....J
0 2 4
U [m/s]
beta = 0
0.01
0.008
0.006
0.004
0.002
2
rei vort = 0
0.06
0.05
0.04
0.03
0.02
0.01
0
I~
4
0
2
4
Figure 3: Graphical display of the CdV model showing Sit vs U for oceanic conditions.
The parameter values are appropriate for 55° latitude and t = 10- 7 8- 1 , H = 4000m,
X = 4000km, Y = 1500km. The form stress is plotted for bo = 400m and bo = 800m.
The left panel applies to the ;3-plane and various values for T are used: the leftmost line
represents the momentum balance for typical ACC conditions (T = 10-4m 2 8- 2 , solid line),
for the other lines T is increased (to unrealistic values) by a factor of 5,10· . ·40 (dashed
lines), respectively. The middle panel is for the J-plane (;3 = 0), the right panel for a
;3-plane with neglection of the relative vorticity. Notice the difference in the Sit-axes.
Several important properties are worth mentioning. At first v and B
are exactly out of phase for zero friction and there is no form stress in
this case. Of course, the flow would then not become steady. For zero
friction the Reynolds stress < uv > vanishes as well. This is a special case
of the Eliassen-Palm theorem. Thus, friction plays a twofold role in the
balance of the mean zonal flow: there is a direct frictional effect on U,
manifested here by the bottom friction, and an indirect effect through the
feedback by the topographically induced waves where friction enables to
build up the phase shift and generate bottom form stress. The resonance
of the wave amplitude (9) carries over to the form stress. Thus, if the