

324
Temperature Diff (2010 to 2020)-(1980 to 1990)
- 1.2 - 0 .9
- 0 .6
- 0 .3
0
0.3
0.6
0 .9
1.2
1.5
1.8
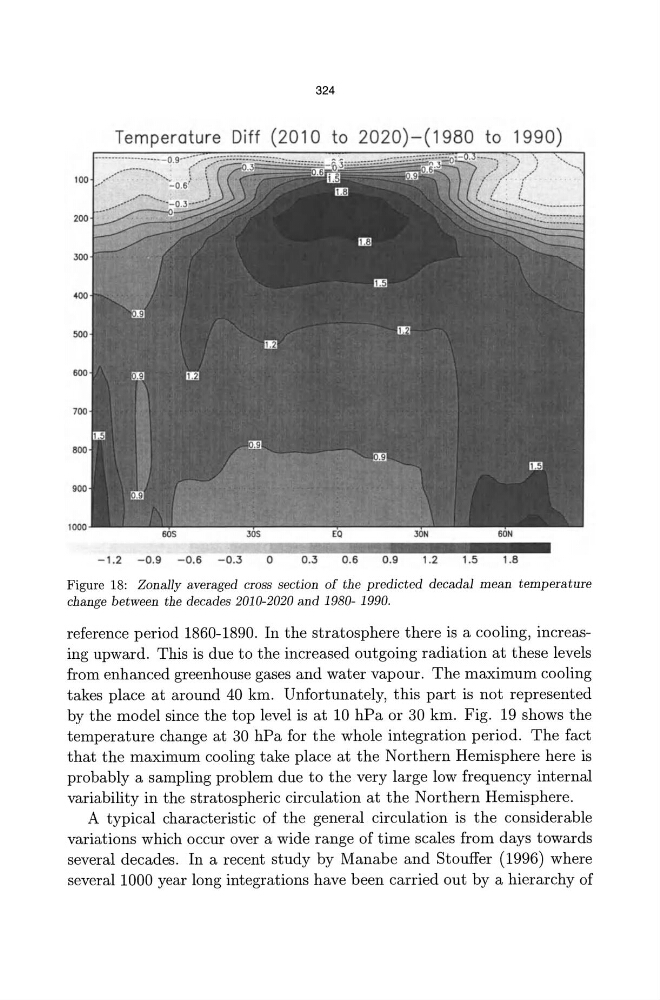
Figure 18: Zonally averaged cross section of the predicted decadal mean temperature
change between the decades 2010-2020 and 1980- 1990.
reference period 1860-1890. In the stratosphere there is a cooling, increasing upward. This is due to the increased outgoing radiation at these levels
from enhanced greenhouse gases and water vapour. The maximum cooling
takes place at around 40 km. Unfortunately, this part is not represented
by the model since the top level is at 10 hPa or 30 km. Fig. 19 shows the
temperature change at 30 hPa for the whole integration period. The fact
that the maximum cooling take place at the Northern Hemisphere here is
probably a sampling problem due to the very large low frequency internal
variability in the stratospheric circulation at the Northern Hemisphere.
A typical characteristic of the general circulation is the considerable
variations which occur over a wide range of time scales from days towards
several decades. In a recent study by Manabe and Stouffer (1996) where
several 1000 year long integrations have been carried out by a hierarchy of
Temperature Diff (2010 to 2020)-(1980 to 1990)
- 1.2 - 0 .9
- 0 .6
- 0 .3
0
0.3
0.6
0 .9
1.2
1.5
1.8
Figure 18: Zonally averaged cross section of the predicted decadal mean temperature
change between the decades 2010-2020 and 1980- 1990.
reference period 1860-1890. In the stratosphere there is a cooling, increasing upward. This is due to the increased outgoing radiation at these levels
from enhanced greenhouse gases and water vapour. The maximum cooling
takes place at around 40 km. Unfortunately, this part is not represented
by the model since the top level is at 10 hPa or 30 km. Fig. 19 shows the
temperature change at 30 hPa for the whole integration period. The fact
that the maximum cooling take place at the Northern Hemisphere here is
probably a sampling problem due to the very large low frequency internal
variability in the stratospheric circulation at the Northern Hemisphere.
A typical characteristic of the general circulation is the considerable
variations which occur over a wide range of time scales from days towards
several decades. In a recent study by Manabe and Stouffer (1996) where
several 1000 year long integrations have been carried out by a hierarchy of