

317
The global heat balance
(model simulated J
Reflected Solar
Rltdiation
103 Wlm 2
Incomin9
Solar
Rltdiation
341 Wlm 2
Atmlllplrer;c
Wintllllll
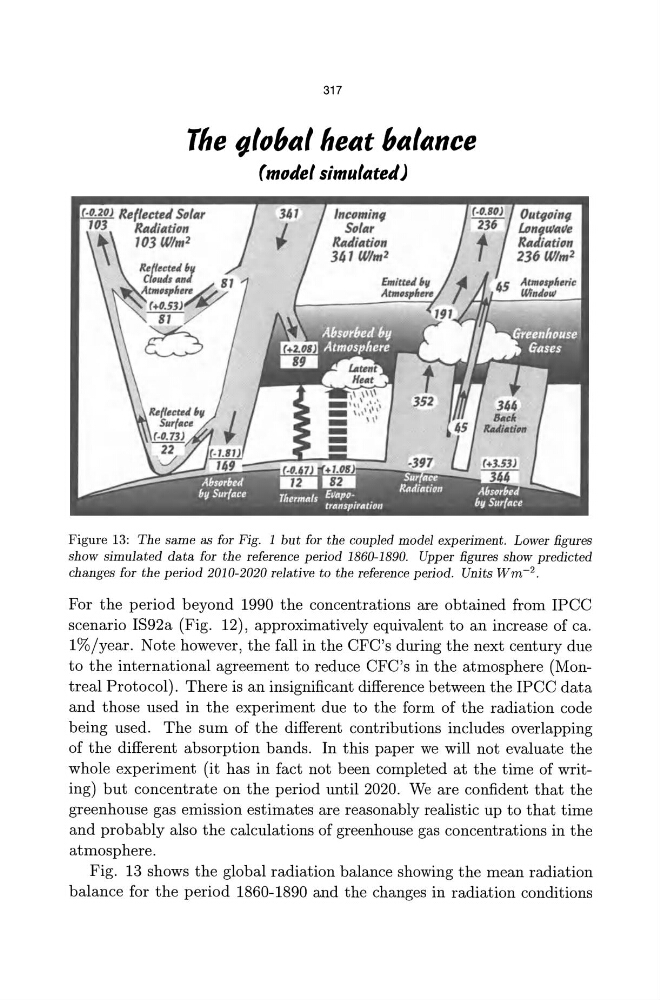
Figure 13: The same as for Fig. 1 but for the coupled model experiment. Lower figures
show simulated data for the reference period 1860-1890. Upper figures show predicted
changes for the period 2010-2020 relative to the reference period. Units Wm- 2 .
For the period beyond 1990 the concentrations are obtained from IPCC
scenario IS92a (Fig. 12), approximativelyequivalent to an increase of ca.
l%/year. Note however, the fall in the CFC's during the next century due
to the international agreement to reduce CFC's in the atmosphere (Montreal Protocol). There is an insignificant difference between the IPCC data
and those used in the experiment due to the form of the radiation code
being used. The sum of the different contributions includes overlapping
of the different absorption bands. In this paper we will not evaluate the
whole experiment (it has in fact not been completed at the time of writing) but concentrate on the period until 2020. We are confident that the
greenhouse gas emission estimates are reasonably realistic up to that time
and probably also the calculations of greenhouse gas concentrations in the
atmosphere.
Fig. 13 shows the global radiation balance showing the mean radiation
balance for the period 1860-1890 and the changes in radiation conditions
The global heat balance
(model simulated J
Reflected Solar
Rltdiation
103 Wlm 2
Incomin9
Solar
Rltdiation
341 Wlm 2
Atmlllplrer;c
Wintllllll
Figure 13: The same as for Fig. 1 but for the coupled model experiment. Lower figures
show simulated data for the reference period 1860-1890. Upper figures show predicted
changes for the period 2010-2020 relative to the reference period. Units Wm- 2 .
For the period beyond 1990 the concentrations are obtained from IPCC
scenario IS92a (Fig. 12), approximativelyequivalent to an increase of ca.
l%/year. Note however, the fall in the CFC's during the next century due
to the international agreement to reduce CFC's in the atmosphere (Montreal Protocol). There is an insignificant difference between the IPCC data
and those used in the experiment due to the form of the radiation code
being used. The sum of the different contributions includes overlapping
of the different absorption bands. In this paper we will not evaluate the
whole experiment (it has in fact not been completed at the time of writing) but concentrate on the period until 2020. We are confident that the
greenhouse gas emission estimates are reasonably realistic up to that time
and probably also the calculations of greenhouse gas concentrations in the
atmosphere.
Fig. 13 shows the global radiation balance showing the mean radiation
balance for the period 1860-1890 and the changes in radiation conditions