

303
Temperature changes of the lower stratosphere
79 80 81 82 83 84 85 86 87 88 89 90 91 92 93 94 95
Temperature changes of the lower troposphere
79 80 81 82 83 84 85 86 87 88 89 90 91 92 93 94 95
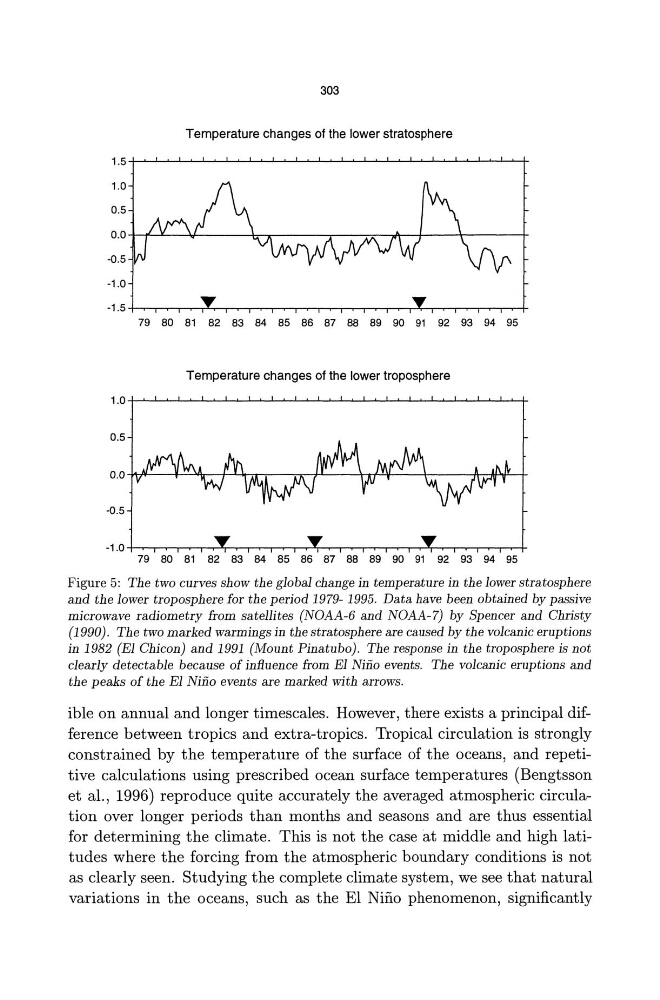
Figure 5: The two curves show the global change in temperature in the lower stratosphere
and the lower troposphere for the period 1979- 1995. Data have been obtained by passive
microwave radiometry from satellites (NOAA-6 and NOAA-7) by Spencer and Christy
(1990). The two marked warmings in the stratosphere are caused by the volcanic eruptions
in 1982 (E1 Chicon) and 1991 (Mount Pinatubo). The response in the troposphere is not
clearly detectable because of influence from E1 Niiio events. The volcanic eruptions and
the peaks of the E1 Nino events are marked with arrows.
ible on annual and longer timescales. However, there exists a principal difference between tropics and extra-tropics. Tropical circulation is strongly
constrained by the temperature of the surface of the oceans, and repetitive calculations using prescribed ocean surface temperatures (Bengtsson
et al., 1996) reproduce quite accurately the averaged atmospheric circulation over longer periods than months and seasons and are thus essential
for determining the climate. This is not the case at middle and high latitudes where the forcing from the atmospheric boundary conditions is not
as clearly seen. Studying the complete climate system, we see that natural
variations in the oceans, such as the EI Nino phenomenon, significantly
Temperature changes of the lower stratosphere
79 80 81 82 83 84 85 86 87 88 89 90 91 92 93 94 95
Temperature changes of the lower troposphere
79 80 81 82 83 84 85 86 87 88 89 90 91 92 93 94 95
Figure 5: The two curves show the global change in temperature in the lower stratosphere
and the lower troposphere for the period 1979- 1995. Data have been obtained by passive
microwave radiometry from satellites (NOAA-6 and NOAA-7) by Spencer and Christy
(1990). The two marked warmings in the stratosphere are caused by the volcanic eruptions
in 1982 (E1 Chicon) and 1991 (Mount Pinatubo). The response in the troposphere is not
clearly detectable because of influence from E1 Niiio events. The volcanic eruptions and
the peaks of the E1 Nino events are marked with arrows.
ible on annual and longer timescales. However, there exists a principal difference between tropics and extra-tropics. Tropical circulation is strongly
constrained by the temperature of the surface of the oceans, and repetitive calculations using prescribed ocean surface temperatures (Bengtsson
et al., 1996) reproduce quite accurately the averaged atmospheric circulation over longer periods than months and seasons and are thus essential
for determining the climate. This is not the case at middle and high latitudes where the forcing from the atmospheric boundary conditions is not
as clearly seen. Studying the complete climate system, we see that natural
variations in the oceans, such as the EI Nino phenomenon, significantly