

286
NORTH AMERICAN DECADAL MODE
TEMPERATURE/PRECIPITATION INDEX
2.0
>< W 1.0
o
Z
I
J- 0
C.9
z
W
0::
J- -1.0
(I)
-2.0
/
TEMPERATURE
I PRECIPITATION
1\/
I \
I \
\
\
\
\
\
-3.0 1::-:7 . ....I---1.. ___ L--...1---L.. ___ L---L---L,;;--:-'I---L---'--I..--1.----.l
1860
1950
2000
YEAR
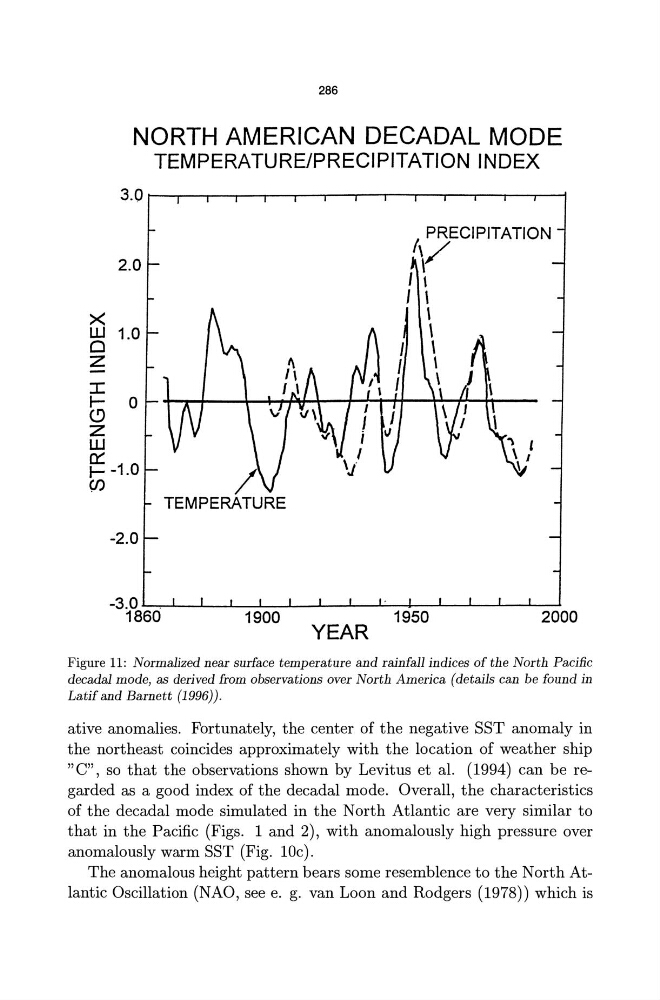
Figure 11: Normalized near surface temperature and rainfall indices of the North Pacific
decadal mode, as derived from observations over North America (details can be found in
Latif and Barnett (1996)).
ative anomalies. Fortunately, the center of the negative SST anomaly in
the northeast coincides approximately with the location of weather ship
"C", so that the observations shown by Levitus et al. (1994) can be regarded as a good index of the decadal mode. Overall, the characteristics
of the decadal mode simulated in the North Atlantic are very similar to
that in the Pacific (Figs. 1 and 2), with anomalously high pressure over
anomalously warm SST (Fig. 10c).
The anomalous height pattern bears some resemblence to the North Atlantic Oscillation (NAO, see e. g. van Loon and Rodgers (1978)) which is
NORTH AMERICAN DECADAL MODE
TEMPERATURE/PRECIPITATION INDEX
2.0
>< W 1.0
o
Z
I
J- 0
C.9
z
W
0::
J- -1.0
(I)
-2.0
/
TEMPERATURE
I PRECIPITATION
1\/
I \
I \
\
\
\
\
\
-3.0 1::-:7 . ....I---1.. ___ L--...1---L.. ___ L---L---L,;;--:-'I---L---'--I..--1.----.l
1860
1950
2000
YEAR
Figure 11: Normalized near surface temperature and rainfall indices of the North Pacific
decadal mode, as derived from observations over North America (details can be found in
Latif and Barnett (1996)).
ative anomalies. Fortunately, the center of the negative SST anomaly in
the northeast coincides approximately with the location of weather ship
"C", so that the observations shown by Levitus et al. (1994) can be regarded as a good index of the decadal mode. Overall, the characteristics
of the decadal mode simulated in the North Atlantic are very similar to
that in the Pacific (Figs. 1 and 2), with anomalously high pressure over
anomalously warm SST (Fig. 10c).
The anomalous height pattern bears some resemblence to the North Atlantic Oscillation (NAO, see e. g. van Loon and Rodgers (1978)) which is