

279
105
105
8
106
106
107
107
108
[mm]
108
[mm]
109
109
12
110
6
110
8
111
4
111
4
---,
2
~ 112
112
0
0
.~ 113
113
- 4
-- 2
114
114
-8
- 4
115
- 12
115
116
11 6
117
117
118
118
119
119
140E
180
140W
140E
180
140W
Longitude
Longitude
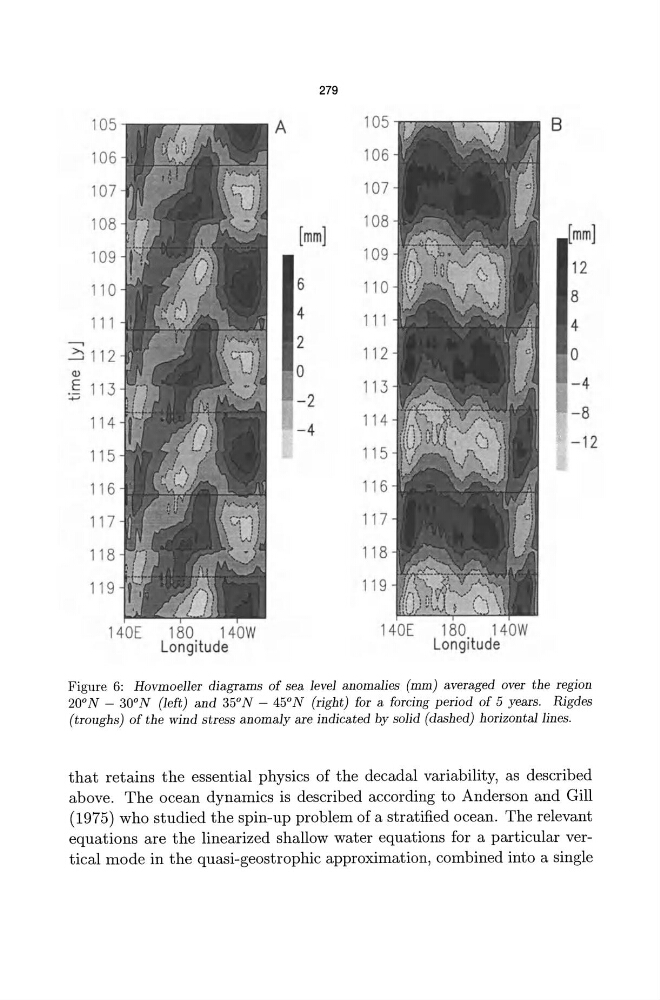
Figure 6: Hovmoeller diagrams of sea level anomalies (mm) averaged over the region
20° N - 30° N (left) and 35° N - 45° N (right) for a forcing period of 5 years. Rigdes
(troughs) of the wind stress anomaly are indicated by solid (dash ed) horizontal lines.
that retains the essential physics of the decadal variability, as described
above. The ocean dynamics is described according to Anderson and Gill
(1975) who studied the spin-up problem of a stratified ocean. The relevant
equations are the linearized shallow water equations for a particular vertical mode in the quasi-geostrophic approximation, combined into a single
105
105
8
106
106
107
107
108
[mm]
108
[mm]
109
109
12
110
6
110
8
111
4
111
4
---,
2
~ 112
112
0
0
.~ 113
113
- 4
-- 2
114
114
-8
- 4
115
- 12
115
116
11 6
117
117
118
118
119
119
140E
180
140W
140E
180
140W
Longitude
Longitude
Figure 6: Hovmoeller diagrams of sea level anomalies (mm) averaged over the region
20° N - 30° N (left) and 35° N - 45° N (right) for a forcing period of 5 years. Rigdes
(troughs) of the wind stress anomaly are indicated by solid (dash ed) horizontal lines.
that retains the essential physics of the decadal variability, as described
above. The ocean dynamics is described according to Anderson and Gill
(1975) who studied the spin-up problem of a stratified ocean. The relevant
equations are the linearized shallow water equations for a particular vertical mode in the quasi-geostrophic approximation, combined into a single