

IZ
:J
350
340
1964
1966
240
35.0
34.0
1968
1970
1972
TIME
(YEARS)
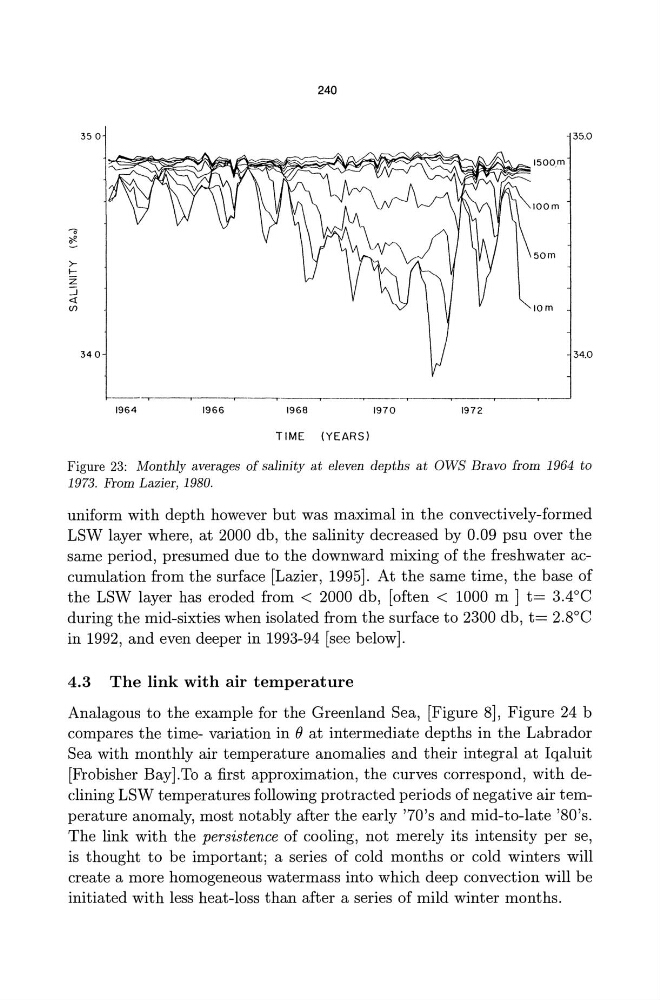
Figure 23: Monthly averages of salinity at eleven depths at OWS Bravo from 1964 to
1973. From Lazier, 1980.
uniform with depth however but was maximal in the convectively-formed
LSW layer where, at 2000 db, the salinity decreased by 0.09 psu over the
same period, presumed due to the downward mixing of the freshwater accumulation from the surface [Lazier, 1995]. At the same time, the base of
the LSW layer has eroded from < 2000 db, [often < 1000 m ] t= 3.4°C
during the mid-sixties when isolated from the surface to 2300 db, t= 2.8°C
in 1992, and even deeper in 1993-94 [see below].
4.3 The link with air temperature
Analagous to the example for the Greenland Sea, [Figure 8], Figure 24 b
compares the time- variation in e at intermediate depths in the Labrador
Sea with monthly air temperature anomalies and their integral at Iqaluit
[Frobisher Bay].To a first approximation, the curves correspond, with declining LSW temperatures following protracted periods of negative air temperature anomaly, most notably after the early '70's and mid-to-late '80's.
The link with the persistence of cooling, not merely its intensity per se,
is thought to be important; a series of cold months or cold winters will
create a more homogeneous watermass into which deep convection will be
initiated with less heat-loss than after a series of mild winter months.
:J
350
340
1964
1966
240
35.0
34.0
1968
1970
1972
TIME
(YEARS)
Figure 23: Monthly averages of salinity at eleven depths at OWS Bravo from 1964 to
1973. From Lazier, 1980.
uniform with depth however but was maximal in the convectively-formed
LSW layer where, at 2000 db, the salinity decreased by 0.09 psu over the
same period, presumed due to the downward mixing of the freshwater accumulation from the surface [Lazier, 1995]. At the same time, the base of
the LSW layer has eroded from < 2000 db, [often < 1000 m ] t= 3.4°C
during the mid-sixties when isolated from the surface to 2300 db, t= 2.8°C
in 1992, and even deeper in 1993-94 [see below].
4.3 The link with air temperature
Analagous to the example for the Greenland Sea, [Figure 8], Figure 24 b
compares the time- variation in e at intermediate depths in the Labrador
Sea with monthly air temperature anomalies and their integral at Iqaluit
[Frobisher Bay].To a first approximation, the curves correspond, with declining LSW temperatures following protracted periods of negative air temperature anomaly, most notably after the early '70's and mid-to-late '80's.
The link with the persistence of cooling, not merely its intensity per se,
is thought to be important; a series of cold months or cold winters will
create a more homogeneous watermass into which deep convection will be
initiated with less heat-loss than after a series of mild winter months.