

237
1.0
CTe
~
APPROXIMATE
•
DEPTH
~
\111)
~
22!Ii!
26.4
-.I
~
~
340
26.5
~
~
26.6
~
460
~
e..:
~
.f
550
~
26.7
I-.:
~
610
26.8
~
~
56e
26.9
~
~
'q:
•
~
19~0
1960
1970
J980
YEAR
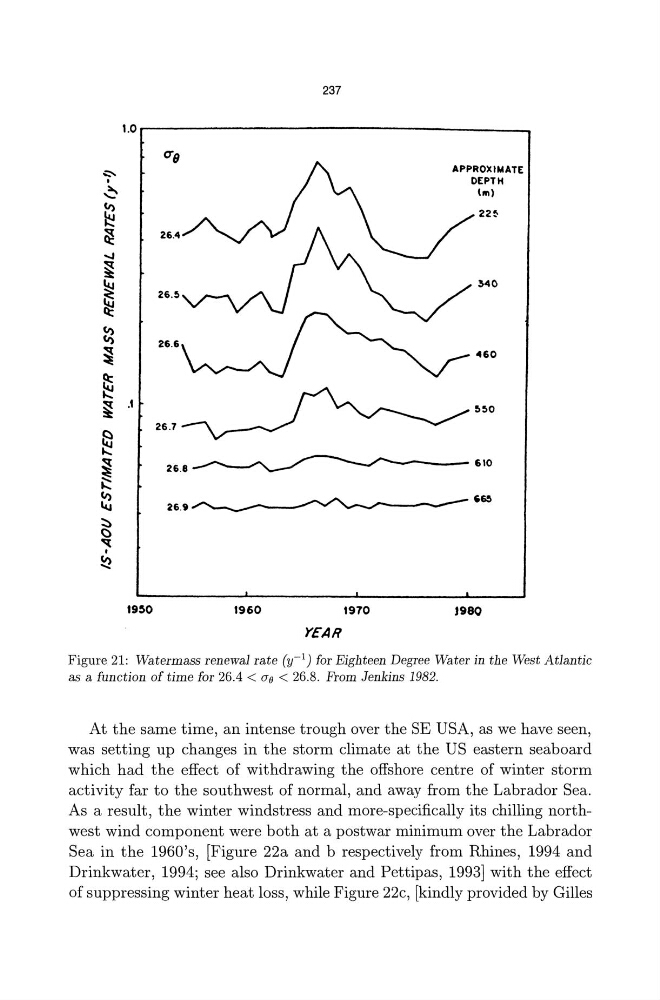
Figure 21: Watermass renewal rate (y-l) for Eighteen Degree Water in the West Atlantic
as a function of time for 26.4 < 0"9 < 26.8. From Jenkins 1982.
At the same time, an intense trough over the SE USA, as we have seen,
was setting up changes in the storm climate at the US eastern seaboard
which had the effect of withdrawing the offshore centre of winter storm
activity far to the southwest of normal, and away from the Labrador Sea.
As a result, the winter windstress and more-specifically its chilling northwest wind component were both at a postwar minimum over the Labrador
Sea in the 1960's, [Figure 22a and b respectively from Rhines, 1994 and
Drinkwater, 1994; see also Drinkwater and Pettipas, 1993] with the effect
of suppressing winter heat loss, while Figure 22c, [kindly provided by Gilles
1.0
CTe
~
APPROXIMATE
•
DEPTH
~
\111)
~
22!Ii!
26.4
-.I
~
~
340
26.5
~
~
26.6
~
460
~
e..:
~
.f
550
~
26.7
I-.:
~
610
26.8
~
~
56e
26.9
~
~
'q:
•
~
19~0
1960
1970
J980
YEAR
Figure 21: Watermass renewal rate (y-l) for Eighteen Degree Water in the West Atlantic
as a function of time for 26.4 < 0"9 < 26.8. From Jenkins 1982.
At the same time, an intense trough over the SE USA, as we have seen,
was setting up changes in the storm climate at the US eastern seaboard
which had the effect of withdrawing the offshore centre of winter storm
activity far to the southwest of normal, and away from the Labrador Sea.
As a result, the winter windstress and more-specifically its chilling northwest wind component were both at a postwar minimum over the Labrador
Sea in the 1960's, [Figure 22a and b respectively from Rhines, 1994 and
Drinkwater, 1994; see also Drinkwater and Pettipas, 1993] with the effect
of suppressing winter heat loss, while Figure 22c, [kindly provided by Gilles