

235
4.-------------------------------------------,
2
Q)
.....
:::l
1ii .....
0
Q)
0E
~
-2
-4 +r'T"T"T'T"TT"T""T'"rT'"I"'T'"1I""T'"1"'T"T"T"T'T"T"T'T"TT"rT'"I"'T'"1I""T'"1I""T'"1"T"T""1'"T"T"T"TT"T"T""T"'T""1'""T""'I
1945 1950 1955 1960 1965 1970 1975 1980 1985 1990 1995
---0 - 100
-----100 - 200
-0-200
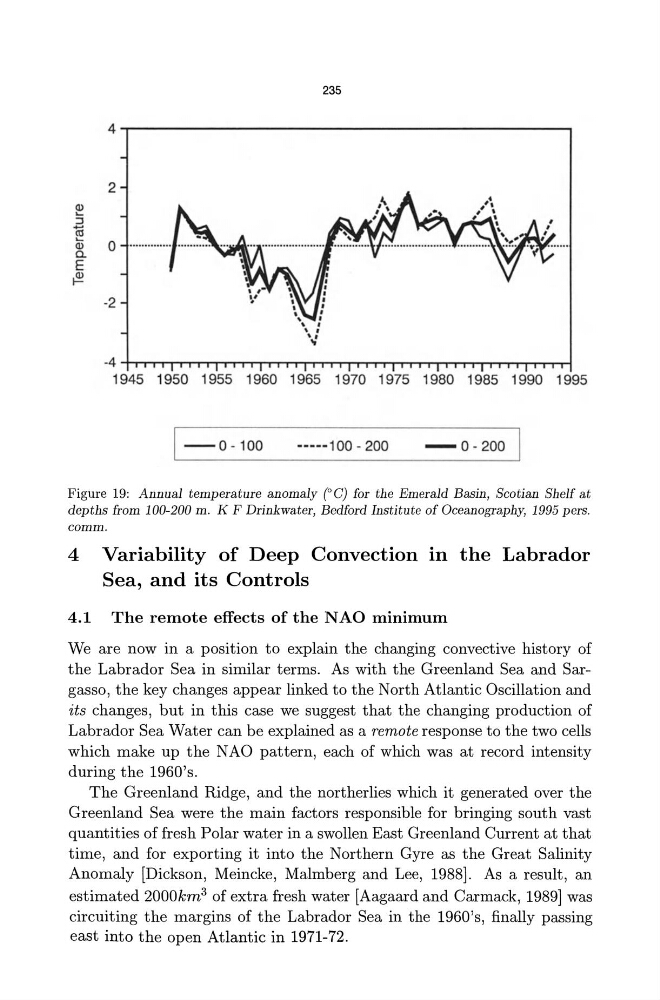
Figure 19: Annual temperature anomaly caC) for the Emerald Basin, Scotian Shelf at
depths from 100-200 m . K F Drinkwater, Bedford Insti t ute of Oceanography, 1995 pers.
comm.
4 Variability of Deep Convection in the Labrador
Sea, and its Controls
4 .1 The remote effects of the NAO minimum
We are now in a position to explain the changing convective history of
the Labrador Sea in similar terms. As with the Greenland Sea and Sargasso, the key changes appear linked to the North Atlantic Oscillation and
its changes, but in this case we suggest that the changing production of
Labrador Sea Water can be explained as a remote response to the two cells
which make up the N AO pattern, each of which was at record intensity
during the 1960's.
The Greenland Ridge, and the northerlies which it generated over the
Greenland Sea were the main factors responsible for bringing south vast
quantities of fresh Polar water in a swollen East Greenland Current at that
time, and for exporting it into the Northern Gyre as the Great Salinity
Anomaly [Dickson, Meincke, Malmberg and Lee, 1988]. As a result, an
estimated 2000km 3 of extra fresh water [Aagaard and Carmack, 1989] was
circuiting the margins of the Labrador Sea in the 1960's, finally passing
east into the open Atlantic in 1971-72.
4.-------------------------------------------,
2
Q)
.....
:::l
1ii .....
0
Q)
0E
~
-2
-4 +r'T"T"T'T"TT"T""T'"rT'"I"'T'"1I""T'"1"'T"T"T"T'T"T"T'T"TT"rT'"I"'T'"1I""T'"1I""T'"1"T"T""1'"T"T"T"TT"T"T""T"'T""1'""T""'I
1945 1950 1955 1960 1965 1970 1975 1980 1985 1990 1995
---0 - 100
-----100 - 200
-0-200
Figure 19: Annual temperature anomaly caC) for the Emerald Basin, Scotian Shelf at
depths from 100-200 m . K F Drinkwater, Bedford Insti t ute of Oceanography, 1995 pers.
comm.
4 Variability of Deep Convection in the Labrador
Sea, and its Controls
4 .1 The remote effects of the NAO minimum
We are now in a position to explain the changing convective history of
the Labrador Sea in similar terms. As with the Greenland Sea and Sargasso, the key changes appear linked to the North Atlantic Oscillation and
its changes, but in this case we suggest that the changing production of
Labrador Sea Water can be explained as a remote response to the two cells
which make up the N AO pattern, each of which was at record intensity
during the 1960's.
The Greenland Ridge, and the northerlies which it generated over the
Greenland Sea were the main factors responsible for bringing south vast
quantities of fresh Polar water in a swollen East Greenland Current at that
time, and for exporting it into the Northern Gyre as the Great Salinity
Anomaly [Dickson, Meincke, Malmberg and Lee, 1988]. As a result, an
estimated 2000km 3 of extra fresh water [Aagaard and Carmack, 1989] was
circuiting the margins of the Labrador Sea in the 1960's, finally passing
east into the open Atlantic in 1971-72.