

232
50· ,--------,,------.
40'
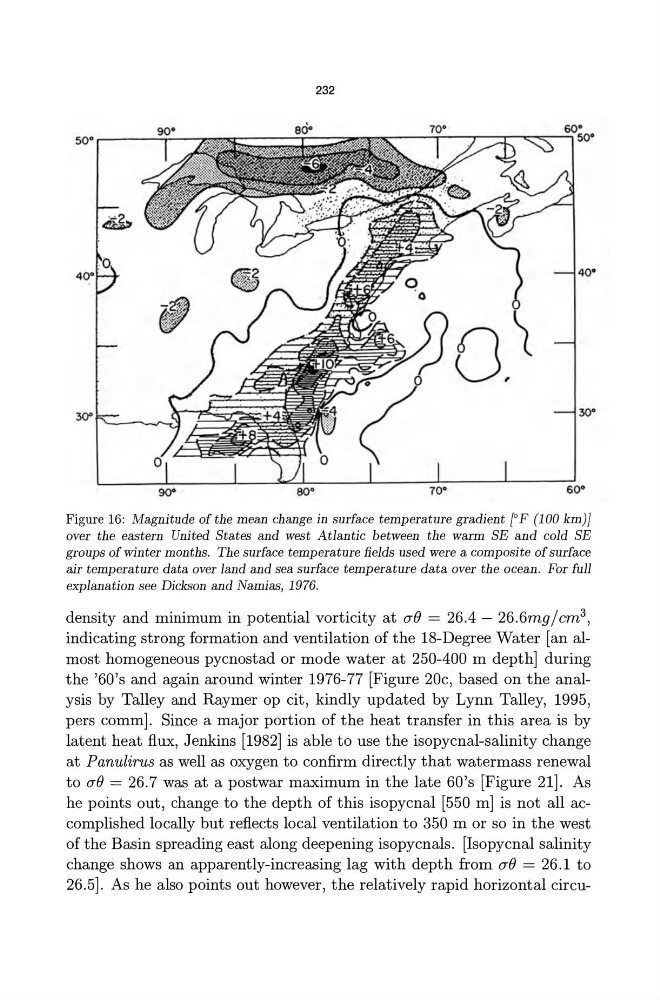
Figure 16: Magnitude of the mean change in surface temperature gradient r F (100 km)]
over the eastern United States and west Atlantic between the warm SE and cold SE
groups of winter months. The surface temperature fields used w ere a composite of surface
air temperature data over land and sea surface temperature data over the ocean. For full
explanation see Dickson and Namias, 1976.
density and minimum in potential vorticity at aB = 26.4 - 26.6mg/cm 3 ,
indicating strong formation and ventilation of the 18-Degree Water [an almost homogeneous pycnostad or mode water at 250-400 m depth] during
the '60's and again around winter 1976-77 [Figure 20c, based on the analysis by Talley and Raymer op cit, kindly updated by Lynn Talley, 1995,
pers comm]. Since a major portion of the heat transfer in this area is by
latent heat flux, Jenkins [1982] is able to use the isopycnal-salinity change
at Panulirus as well as oxygen to confirm directly that watermass renewal
to afJ = 26.7 was at a postwar maximum in the late 60 's [Figure 21]. As
he points out, change to the depth of this isopycnal [550 m] is not all accomplished locally but reflects local ventilation to 350 m or so in the west
of the Basin spreading east along deepening isopycnals . [Isopycnal salinity
change shows an apparently-increasing lag with depth from afJ = 26 .1 to
26.5]. As he also points out however, the relatively rapid horizontal circu-
50· ,--------,,------.
40'
Figure 16: Magnitude of the mean change in surface temperature gradient r F (100 km)]
over the eastern United States and west Atlantic between the warm SE and cold SE
groups of winter months. The surface temperature fields used w ere a composite of surface
air temperature data over land and sea surface temperature data over the ocean. For full
explanation see Dickson and Namias, 1976.
density and minimum in potential vorticity at aB = 26.4 - 26.6mg/cm 3 ,
indicating strong formation and ventilation of the 18-Degree Water [an almost homogeneous pycnostad or mode water at 250-400 m depth] during
the '60's and again around winter 1976-77 [Figure 20c, based on the analysis by Talley and Raymer op cit, kindly updated by Lynn Talley, 1995,
pers comm]. Since a major portion of the heat transfer in this area is by
latent heat flux, Jenkins [1982] is able to use the isopycnal-salinity change
at Panulirus as well as oxygen to confirm directly that watermass renewal
to afJ = 26.7 was at a postwar maximum in the late 60 's [Figure 21]. As
he points out, change to the depth of this isopycnal [550 m] is not all accomplished locally but reflects local ventilation to 350 m or so in the west
of the Basin spreading east along deepening isopycnals . [Isopycnal salinity
change shows an apparently-increasing lag with depth from afJ = 26 .1 to
26.5]. As he also points out however, the relatively rapid horizontal circu-