

o
z
~
!
~
<:>
.....
20
10
0
-10
-20
-30
-40
9
20
'" ~ " .
~,A.
:'\ 1.1\ A
10 \ i. ,-: ;, ~
:' :"\ ~ :. :~. . ,v: ~
I
o
. . . . . ' .. :_ • .
_ _ ~IIn. :.. :. ~ • e.. .
~'!
• • ,
•• ••
. "
=~~ 'i ~ V.; \.; \ :c.: ~ , \.7 ~ ,. \t '\; \" V
. . ,; .
1955
1960
1965
.·.iViti't:. ~'
·
:-r:, ..
':J"~. '.
. . -. .... . . . .
... ,:t. ."
.. ~ .
. ..
. ' -. . .
. .
• ' •• -.: .II• • I·
. · ':
: •• a. ••••
.
. - , ' .. -
.
. . ..,.-. ~-. . . - .. :- =- '.:
. ~_\..,.. i,,·
. . ,
-40 -30 -20 . -10 0 10 20
10 mb ZONAL WINO
1970
o
z
~
g
N~
<:>
.....
1975
1980
1985
1990
- 10 0
10 20
10 mb ZONAl WIND
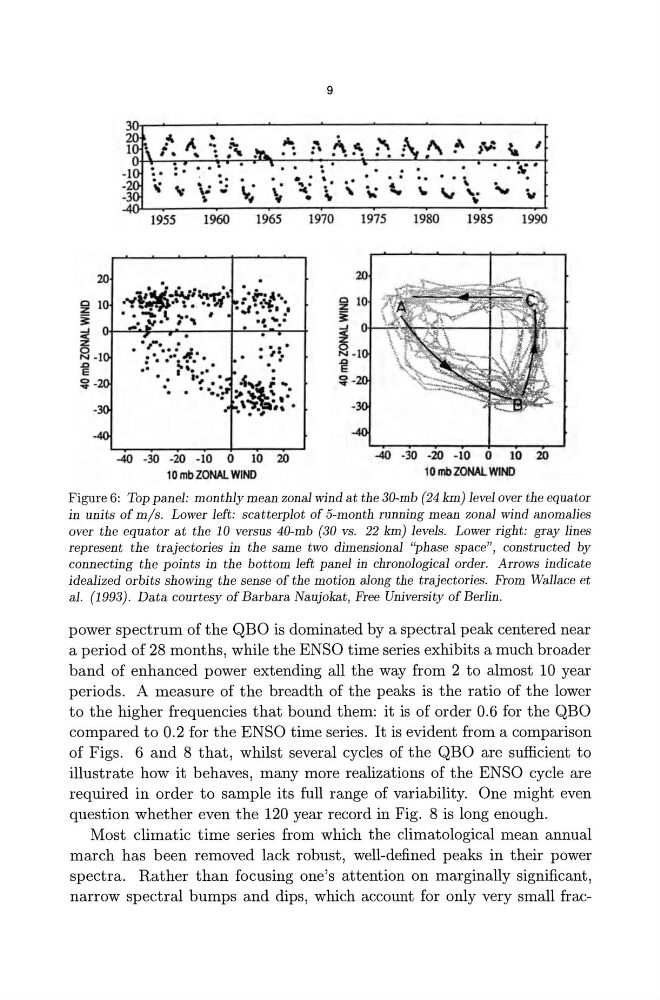
Figure 6: Top panel: monthly mean zonal wind at the 30-mb (24 km) level over the equator
in units of m/s. Lower left: scatterplot of 5-month running mean zonal wind anomalies
over the equator at the 10 versus 40-mb (30 vs. 22 km) levels. Lower right: gray lines
represent the trajectories in the same two dimensional "phase space", constructed by
connecting the points in the bottom left panel in chronological order. Arrows indicate
idealized orbits showing the sense of the motion along the trajectories. From Wallace et
al. (1993). Data courtesy of Barbara Naujokat, Free University of Berlin .
power spectrum of the QBO is dominated by a spectral peak centered near
a period of 28 months, while the ENSO time series exhibits a much broader
band of enhanced power extending all the way from 2 to almost 10 year
periods. A measure of the breadth of the peaks is the ratio of the lower
to the higher frequencies that bound them: it is of order 0.6 for the QBO
compared to 0.2 for the ENSO time series. It is evident from a comparison
of Figs. 6 and 8 that, whilst several cycles of the QBO are sufficient to
illustrate how it behaves, many more realizations of the ENSO cycle are
required in order to sample its full range of variability. One might even
question whether even the 120 year record in Fig. 8 is long enough.
Most climatic time series from which the climatological mean annual
march has been removed lack robust, well-defined peaks in their power
spectra. Rather than focusing one's attention on marginally significant,
narrow spectral bumps and dips, which account for only very small frac-
z
~
!
~
<:>
.....
20
10
0
-10
-20
-30
-40
9
20
'" ~ " .
~,A.
:'\ 1.1\ A
10 \ i. ,-: ;, ~
:' :"\ ~ :. :~. . ,v: ~
I
o
. . . . . ' .. :_ • .
_ _ ~IIn. :.. :. ~ • e.. .
~'!
• • ,
•• ••
. "
=~~ 'i ~ V.; \.; \ :c.: ~ , \.7 ~ ,. \t '\; \" V
. . ,; .
1955
1960
1965
.·.iViti't:. ~'
·
:-r:, ..
':J"~. '.
. . -. .... . . . .
... ,:t. ."
.. ~ .
. ..
. ' -. . .
. .
• ' •• -.: .II• • I·
. · ':
: •• a. ••••
.
. - , ' .. -
.
. . ..,.-. ~-. . . - .. :- =- '.:
. ~_\..,.. i,,·
. . ,
-40 -30 -20 . -10 0 10 20
10 mb ZONAL WINO
1970
o
z
~
g
N~
<:>
.....
1975
1980
1985
1990
- 10 0
10 20
10 mb ZONAl WIND
Figure 6: Top panel: monthly mean zonal wind at the 30-mb (24 km) level over the equator
in units of m/s. Lower left: scatterplot of 5-month running mean zonal wind anomalies
over the equator at the 10 versus 40-mb (30 vs. 22 km) levels. Lower right: gray lines
represent the trajectories in the same two dimensional "phase space", constructed by
connecting the points in the bottom left panel in chronological order. Arrows indicate
idealized orbits showing the sense of the motion along the trajectories. From Wallace et
al. (1993). Data courtesy of Barbara Naujokat, Free University of Berlin .
power spectrum of the QBO is dominated by a spectral peak centered near
a period of 28 months, while the ENSO time series exhibits a much broader
band of enhanced power extending all the way from 2 to almost 10 year
periods. A measure of the breadth of the peaks is the ratio of the lower
to the higher frequencies that bound them: it is of order 0.6 for the QBO
compared to 0.2 for the ENSO time series. It is evident from a comparison
of Figs. 6 and 8 that, whilst several cycles of the QBO are sufficient to
illustrate how it behaves, many more realizations of the ENSO cycle are
required in order to sample its full range of variability. One might even
question whether even the 120 year record in Fig. 8 is long enough.
Most climatic time series from which the climatological mean annual
march has been removed lack robust, well-defined peaks in their power
spectra. Rather than focusing one's attention on marginally significant,
narrow spectral bumps and dips, which account for only very small frac-