

168
100,---------~--------_.----------~----------,_--------~
1000
2000
3000
4000
5000
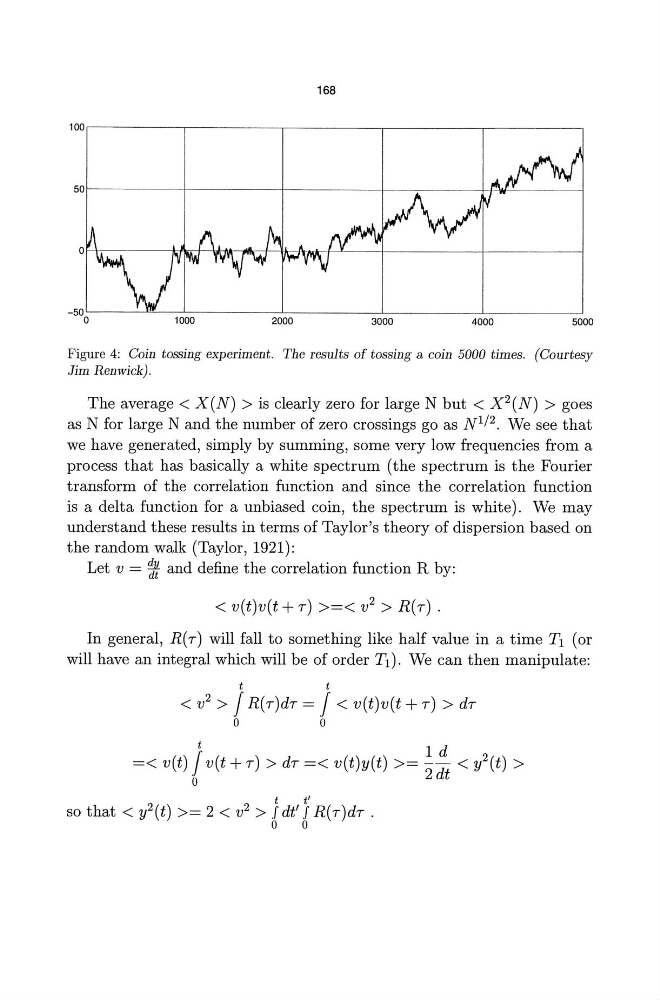
Figure 4: Coin tossing experiment. The results of tossing a coin 5000 times. (Courtesy
Jim Renwick).
The average < X (N) > is clearly zero for large N but < X 2 (N) > goes
as N for large N and the number of zero crossings go as N 1 j2. We see that
we have generated, simply by summing, some very low frequencies from a
process that has basically a white spectrum (the spectrum is the Fourier
transform of the correlation function and since the correlation function
is a delta function for a unbiased coin, the spectrum is white). We may
understand these results in terms of Taylor's theory of dispersion based on
the random walk (Taylor, 1921):
Let v = 1t and define the correlation function R by:
< v(t)v(t + r) >=< v 2 > R(r) .
In general, R( r) will fall to something like half value in a time Tl (or
will have an integral which will be of order Tl). We can then manipulate:
t
t
< v 2 > J R(r)dr = J < v(t)v(t + r) > dr
o
0
t I d
=< v(t) J v(t + r) > dr =< v(t)y(t) >= --d < y2(t) >
o
2 t
t
t'
so that < y2(t) >= 2 < v 2 > J dt' J R(r)dr .
o 0
100,---------~--------_.----------~----------,_--------~
1000
2000
3000
4000
5000
Figure 4: Coin tossing experiment. The results of tossing a coin 5000 times. (Courtesy
Jim Renwick).
The average < X (N) > is clearly zero for large N but < X 2 (N) > goes
as N for large N and the number of zero crossings go as N 1 j2. We see that
we have generated, simply by summing, some very low frequencies from a
process that has basically a white spectrum (the spectrum is the Fourier
transform of the correlation function and since the correlation function
is a delta function for a unbiased coin, the spectrum is white). We may
understand these results in terms of Taylor's theory of dispersion based on
the random walk (Taylor, 1921):
Let v = 1t and define the correlation function R by:
< v(t)v(t + r) >=< v 2 > R(r) .
In general, R( r) will fall to something like half value in a time Tl (or
will have an integral which will be of order Tl). We can then manipulate:
t
t
< v 2 > J R(r)dr = J < v(t)v(t + r) > dr
o
0
t I d
=< v(t) J v(t + r) > dr =< v(t)y(t) >= --d < y2(t) >
o
2 t
t
t'
so that < y2(t) >= 2 < v 2 > J dt' J R(r)dr .
o 0