

115
c)
C'2
d) r---~--~~~--~---'
.::.:: . . . .. ··::···;;;· ·i.- T '~
'- -~ -C'Sa
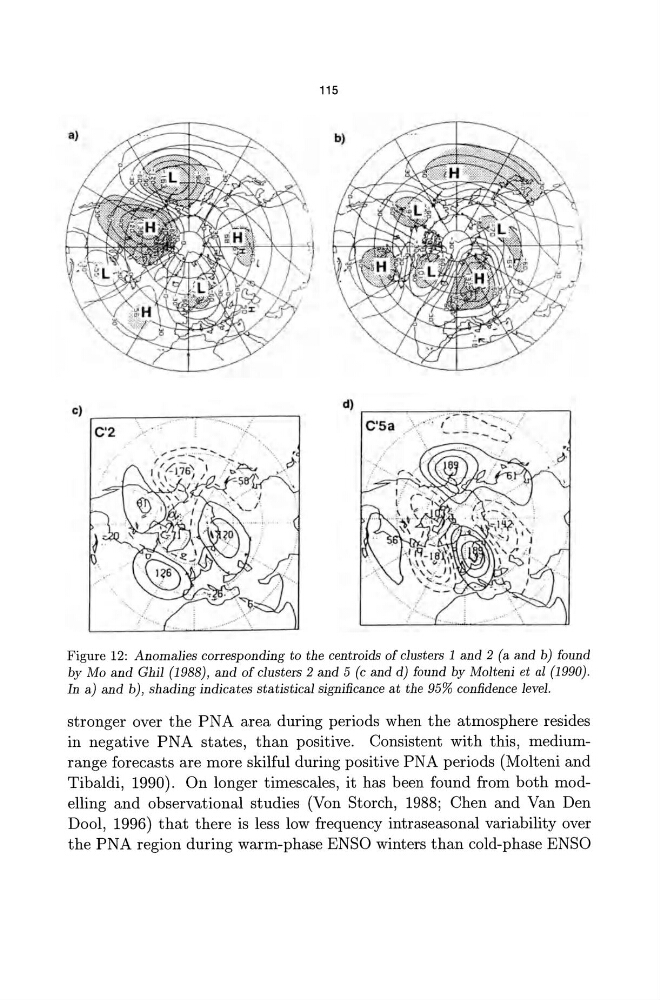
Figure 12: Anomalies corresponding to the centroids of clusters 1 and 2 (a and b) found
by Mo and Ghil (1988) , and of clusters 2 and 5 (c and d) found by Molteni et al (1990) .
In a) and b), shading indicates statistical significance at the 95% confidence level.
stronger over the PNA area during periods when the atmosphere resides
in negative PNA states, than positive. Consistent with this, mediumrange forecasts are more skilful during positive PN A periods (Molteni and
Tibaldi, 1990). On longer timescales, it has been found from both modelling and observational studies (Von Storch, 1988; Chen and Van Den
Dool, 1996) that there is less low frequency intraseasonal variability over
the PNA region during warm-phase ENSO winters than cold-phase ENSO
c)
C'2
d) r---~--~~~--~---'
.::.:: . . . .. ··::···;;;· ·i.- T '~
'- -~ -C'Sa
Figure 12: Anomalies corresponding to the centroids of clusters 1 and 2 (a and b) found
by Mo and Ghil (1988) , and of clusters 2 and 5 (c and d) found by Molteni et al (1990) .
In a) and b), shading indicates statistical significance at the 95% confidence level.
stronger over the PNA area during periods when the atmosphere resides
in negative PNA states, than positive. Consistent with this, mediumrange forecasts are more skilful during positive PN A periods (Molteni and
Tibaldi, 1990). On longer timescales, it has been found from both modelling and observational studies (Von Storch, 1988; Chen and Van Den
Dool, 1996) that there is less low frequency intraseasonal variability over
the PNA region during warm-phase ENSO winters than cold-phase ENSO