

108
90'W
0'
b)
_r><-..--. 60' N
O'
30'S
60' S
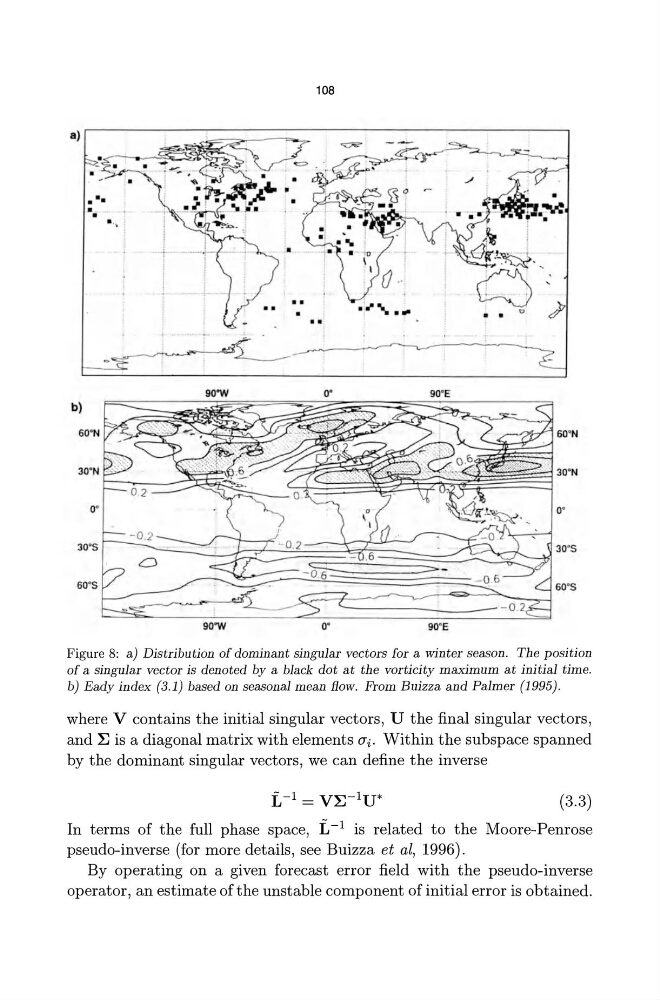
Figure 8: a) Distribution of dominant singular vectors for a winter season. The position
of a singular vector is denoted by a black dot at the vorticity maximum at initial time.
b) Eady index (3.1) based on seasonal mean flow. From Buizza and Palmer (1995).
where V contains the initial singular vectors, U the final singular vectors,
and ~ is a diagonal matrix with elements (Ji. Within the subspace spanned
by the dominant singular vectors, we can define the inverse
(3.3)
In terms of the full phase space, L -1 is related to the Moore-Penrose
pseudo-inverse (for more details, see Buizza et al, 1996).
By operating on a given forecast error field with the pseudo-inverse
operator, an estimate of the unstable component of initial error is obtained.
90'W
0'
b)
_r><-..--. 60' N
O'
30'S
60' S
Figure 8: a) Distribution of dominant singular vectors for a winter season. The position
of a singular vector is denoted by a black dot at the vorticity maximum at initial time.
b) Eady index (3.1) based on seasonal mean flow. From Buizza and Palmer (1995).
where V contains the initial singular vectors, U the final singular vectors,
and ~ is a diagonal matrix with elements (Ji. Within the subspace spanned
by the dominant singular vectors, we can define the inverse
(3.3)
In terms of the full phase space, L -1 is related to the Moore-Penrose
pseudo-inverse (for more details, see Buizza et al, 1996).
By operating on a given forecast error field with the pseudo-inverse
operator, an estimate of the unstable component of initial error is obtained.