

76
Luis Felipe Niencheski . Maria da Gra~a Baumgarten· Gilberto Fillmann . Herbert L. Windom
80
60
v JUN 89
2
AUG 89
40
v
20
l>
l>
&
•
..... oIlo.<.
0
80
l>
MAY 90 v
3
4
JUN90
60
l>
l>
"
l>
l>
.p
40
v
lIIrIl.
~
'IV
~
20
l>
V
I ~
2v
"
w
0
!;,(
80
a:
fZ 60
5
AUG0 1, 90
6
AUG 30, 90
40
v
20 ICl~
vJ;.~~d>~
IS>
l>
0
80
60
7
DEC 90
8
APR 91
40
v
20 ~c.4l~
V
l>
V V
bl>
V
'IV
~l>v~ .~
0
0
5 10 15 20 25 30 35
0
5
10 15 20 25 30 35
SALINITY
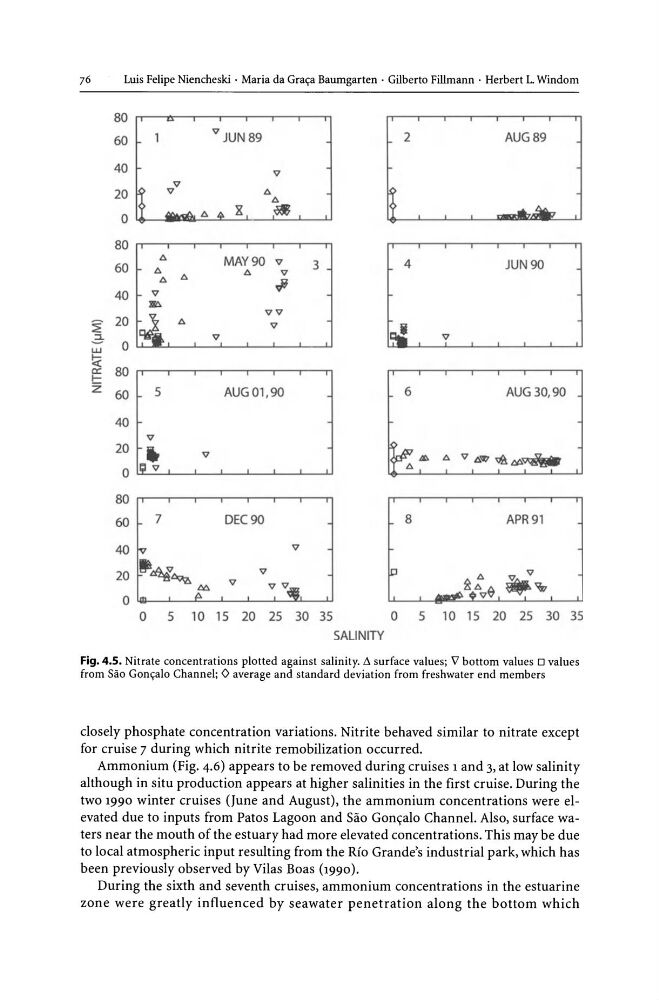
Fig. 4.5. Nitrate concentrations plotted against salinity. t. surface values; V bottom values 0 values
from Sao Gon~alo Channel; 0 average and standard deviation from freshwater end members
closely phosphate concentration variations. Nitrite behaved similar to nitrate except
for cruise 7 during which nitrite remobilization occurred.
Ammonium (Fig. 4.6) appears to be removed during cruises 1 and 3, at low salinity
although in situ production appears at higher salinities in the first cruise. During the
two 1990 winter cruises (June and August), the ammonium concentrations were elevated due to inputs from Patos Lagoon and Sao Gon«;:alo Channel. Also, surface waters near the mouth of the estuary had more elevated concentrations. This may be due
to local atmospheric input resulting from the Rio Grande's industrial park, which has
been previously observed by Vilas Boas (1990).
During the sixth and seventh cruises, ammonium concentrations in the estuarine
zone were greatly influenced by seawater penetration along the bottom which
Luis Felipe Niencheski . Maria da Gra~a Baumgarten· Gilberto Fillmann . Herbert L. Windom
80
60
v JUN 89
2
AUG 89
40
v
20
l>
l>
&
•
..... oIlo.<.
0
80
l>
MAY 90 v
3
4
JUN90
60
l>
l>
"
l>
l>
.p
40
v
lIIrIl.
~
'IV
~
20
l>
V
I ~
2v
"
w
0
!;,(
80
a:
fZ 60
5
AUG0 1, 90
6
AUG 30, 90
40
v
20 ICl~
vJ;.~~d>~
IS>
l>
0
80
60
7
DEC 90
8
APR 91
40
v
20 ~c.4l~
V
l>
V V
bl>
V
'IV
~l>v~ .~
0
0
5 10 15 20 25 30 35
0
5
10 15 20 25 30 35
SALINITY
Fig. 4.5. Nitrate concentrations plotted against salinity. t. surface values; V bottom values 0 values
from Sao Gon~alo Channel; 0 average and standard deviation from freshwater end members
closely phosphate concentration variations. Nitrite behaved similar to nitrate except
for cruise 7 during which nitrite remobilization occurred.
Ammonium (Fig. 4.6) appears to be removed during cruises 1 and 3, at low salinity
although in situ production appears at higher salinities in the first cruise. During the
two 1990 winter cruises (June and August), the ammonium concentrations were elevated due to inputs from Patos Lagoon and Sao Gon«;:alo Channel. Also, surface waters near the mouth of the estuary had more elevated concentrations. This may be due
to local atmospheric input resulting from the Rio Grande's industrial park, which has
been previously observed by Vilas Boas (1990).
During the sixth and seventh cruises, ammonium concentrations in the estuarine
zone were greatly influenced by seawater penetration along the bottom which