

72
Luis Felipe Niencheski . Maria da Gra~a Baumgarten . Gilberto Fillmann . Herbert L. Windom
35
30 ~r;.
2
v~~
25
:r AUG a,
20
15
10
~~
5
0
35
30
4
25 3
20
JUN90
15
MAY 90
10
>- 5
j
t::
0
z
::J 35
«
VI
30
6
J'V-vv"V~rli.
5
25
'7\ A/V
20
15
AUG01,90
VI AUG 30,90
10
.~
5
.?'"
0
35
30
(V;:8
V"'7
25
7
, . / V~v~7~,.g::;
20
~.aAA~/>
15
10
5
APR91
.I: -A04""'-froA-Cri>
0
0
5
10
15
20
0
5
10
15
20
STATION NUMBER
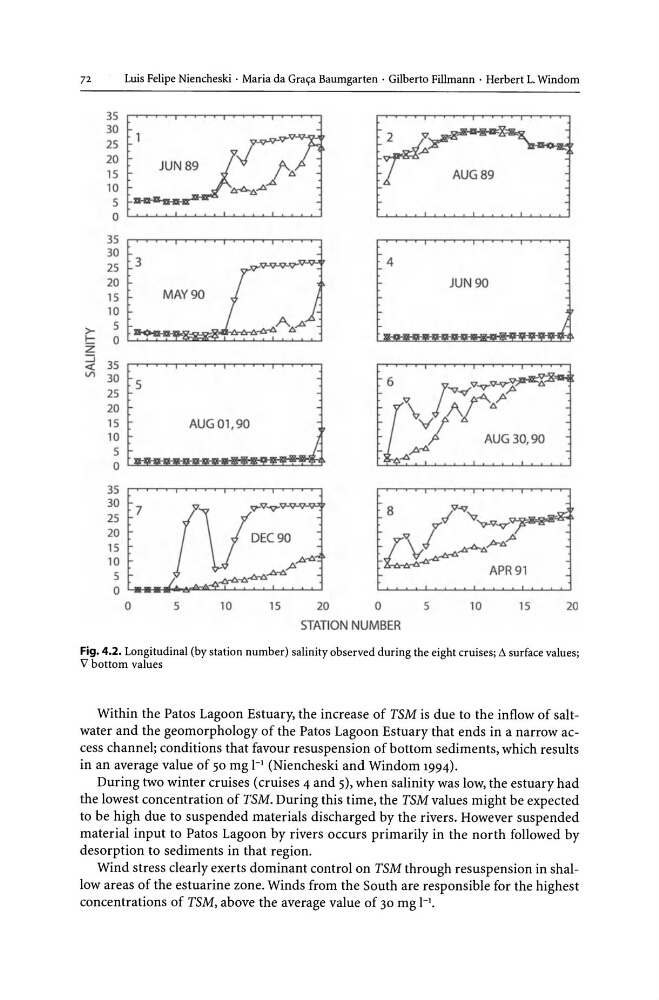
Fig. 4.2. Longitudinal (by station number) salinity observed during the eight cruises; L' l. surface values;
V bottom values
Within the Patos Lagoon Estuary, the increase of TSM is due to the inflow of saltwater and the geomorphology of the Patos Lagoon Estuary that ends in a narrow access channel; conditions that favour resuspension of bottom sediments, which results
in an average value of 50 mg 1-1 (Niencheski and Windom 1994).
During two winter cruises (cruises 4 and 5), when salinity was low, the estuary had
the lowest concentration of TSM. During this time, the TSM values might be expected
to be high due to suspended materials discharged by the rivers. However suspended
material input to Patos Lagoon by rivers occurs primarily in the north followed by
desorption to sediments in that region.
Wind stress clearly exerts dominant control on TSM through resuspension in shallow areas of the estuarine zone. Winds from the South are responsible for the highest
concentrations of TSM, above the average value of 30 mg 1-1.
Luis Felipe Niencheski . Maria da Gra~a Baumgarten . Gilberto Fillmann . Herbert L. Windom
35
30 ~r;.
2
v~~
25
:r AUG a,
20
15
10
~~
5
0
35
30
4
25 3
20
JUN90
15
MAY 90
10
>- 5
j
t::
0
z
::J 35
«
VI
30
6
J'V-vv"V~rli.
5
25
'7\ A/V
20
15
AUG01,90
VI AUG 30,90
10
.~
5
.?'"
0
35
30
(V;:8
V"'7
25
7
, . / V~v~7~,.g::;
20
~.aAA~/>
15
10
5
APR91
.I: -A04""'-froA-Cri>
0
0
5
10
15
20
0
5
10
15
20
STATION NUMBER
Fig. 4.2. Longitudinal (by station number) salinity observed during the eight cruises; L' l. surface values;
V bottom values
Within the Patos Lagoon Estuary, the increase of TSM is due to the inflow of saltwater and the geomorphology of the Patos Lagoon Estuary that ends in a narrow access channel; conditions that favour resuspension of bottom sediments, which results
in an average value of 50 mg 1-1 (Niencheski and Windom 1994).
During two winter cruises (cruises 4 and 5), when salinity was low, the estuary had
the lowest concentration of TSM. During this time, the TSM values might be expected
to be high due to suspended materials discharged by the rivers. However suspended
material input to Patos Lagoon by rivers occurs primarily in the north followed by
desorption to sediments in that region.
Wind stress clearly exerts dominant control on TSM through resuspension in shallow areas of the estuarine zone. Winds from the South are responsible for the highest
concentrations of TSM, above the average value of 30 mg 1-1.